


ASX 200 Forecast 2024-Mar-15
Lower to sideways

Summary
Next 5 weeks
Lower to sideways. Potential upside is marginal to non-existent for at least the next five weeks.
Next 8 months
Significant rally. The ASX 200 will easily eclipse 8000 points and should move above 8200 points in the next 8 months.
2026
A new secular bull market, defined here as a significant multi-decade advance, will commence. Long-term wave structure and price behaviour suggest it will be the greatest bull market in the history of Australian equities.
Disclaimer: at end.
In the wake
Australia's benchmark share market index, the S&P/ASX 200 (ASX 200), closed at 7846.9 points, losing 176.7 points or 2.3% for the week.
Exhibit 1 illustrates the price movement for the ASX 200 during the past week.

Last week, I wrote:
… virtually no upside (28 points or thereabouts) and little to no time remaining for 23WG. A decline of 1.3% or greater in, preferably, two days or less would be the initial clue that 23WG and the entire Diametric have probably completed and that a decline to at least 7496 and possibly as far as 7183 points over at least five weeks has started… Investors should proceed on the presumption that potential upside for the ASX 200 is marginal to non-existent for at least the next five weeks.
The decline of 1.82% on Monday qualifies as initial confirmation of the likelihood that 23WG, the final wave of a NEoWave Diametric, completed at 7853.1 points on 8 March. The implications are discussed further below.
Around the Traps
Exhibit 2 shows a weekly chart of the S&P/ASX 200 Financials Ex A-REIT index. The four major banks comprise two-thirds of this index, so I will refer to it as the Banks.

Last week, I wrote:
The price action in the Banks is very interesting. It is possible that the pending top for this sector is highly significant and that banks will pull back much further than the ASX 200 as investors rotate out of the banks and into mining stocks. I will talk more about this next week.
When I look at a weekly chart of the Banks, it could be construed as a blow-off top.
A blow-off top is a chart pattern that displays a swift and excessive rise in price followed by a rapid decline. At first, the market is manic, as prices move almost vertically, moving far beyond levels that fundamental factors can justify. Suddenly, depression or buyer’s remorse sets in, and the market swiftly erases the prior gains.
Blow-off tops occur at the end of an uptrend. They are climatic, representing an important top that won’t be breached for some time. In my experience, the decline will erase 90-110% of the prior gains at a commensurate rate of descent to the prior rally.
If this is a valid blow-off top for the Banks, this index will return to 7000 points, give or take 200 points. This would represent a circa 17% decline in about 3-5 months.
I am 70% confident it is a blow-off top. The one issue I have with viewing it as such is that a decline of this magnitude does not gel so well with the minimal decline that I am forecasting for the ASX 200. The four major banks comprise about 17-18% of the ASX 200, so material weakness for the banks will weigh heavily on the ASX 200.
Perhaps it is not a blow-off top. Maybe the ASX 200 will fall much further than I am forecasting. The third option, which is what I think we will see unfold, is that there will be a large rotation out of banks and into mining companies. In other words, market weakness attributable to the Banks will be more than offset by strength in mining and related companies (BHP, RIO and Fortescue alone account for circa 15-16% of the ASX 200).
Fortunately, we don't have to speculate. Price action through the rest of March should tell us whether a rotation is occurring or not.
Forecast
Exhibit 3 reveals the daily high-low chart for the ASX 200. A high-low chart plots the period's highs and lows in the order in which they occur.

The decline of 1.82% on Monday qualifies as initial confirmation of the likelihood that 23WG, the final wave of a NEoWave Diametric, completed at 7853.1 points on 8 March.
23WG, Wave-G of the Corrective Price Pattern that commenced in 2023, was close to 100% of the price and 161.8% of the time of 23WA, typical relationships between Wave-G and Wave-A of a Diametric.
The rally from 6770.4 points on 31 October through 7853.1 points on 8 March resembles a textbook NEoWave Diametric. Five of the seven waves tend towards equality in time, and there is obvious expansion through the first four waves of the pattern, followed by contraction for the last three waves.
This means the first phase of the uptrend from October 2023 is complete. Today's drop below 7634.7 points reinforces the thesis that a pullback has started. By breaking this level, the current decline is further and faster (see second red box) than 23WF (the first red box).
This pullback should be at least 1/3 of the price or time of the prior rally, preferably both. A 33% retracement of the prior rally is 7496 points. 33% of the prior rally in terms of time points to 22 April. These are the likely minimum thresholds for this pullback.
The ASX 200 could fall as far as 7183 points, representing a 61.8% retracement of the prior rally. Ordinarily, countertrends in Corrective Price Patterns retrace at least 61.8% and usually a lot more of the prevailing trend, but because this is the first pullback within a new uptrend, when strength should be evident, it should be no more than 61.8%. Regarding time, the first countertrend is usually at least the same time and, in some instances, up to 300% or more of the time of the prior move.
But the six-month high-low chart tells us that this uptrend, labelled 20WD, should probably terminate in the second half of this year or possibly the first half of next year. This chart also tells us that the likely minimum measured move for 20WD is 8200 points. Given this information, it is logical to assume that this pullback will be minimal in nature to allow it sufficient time and to be within striking distance of 8200 points.
As a result, I think the ASX 200 will bottom somewhere around 7496 points in the next five weeks. The actual price low may occur very quickly, but in that scenario, there will be a secondary low (a higher low) around 22 April or not long after, which will count as part of the pullback.
Investors should proceed on the presumption that potential upside for the ASX 200 is marginal to non-existent for at least the next five weeks.
Exhibit 4 reveals the six-monthly high-low chart for the ASX 200.
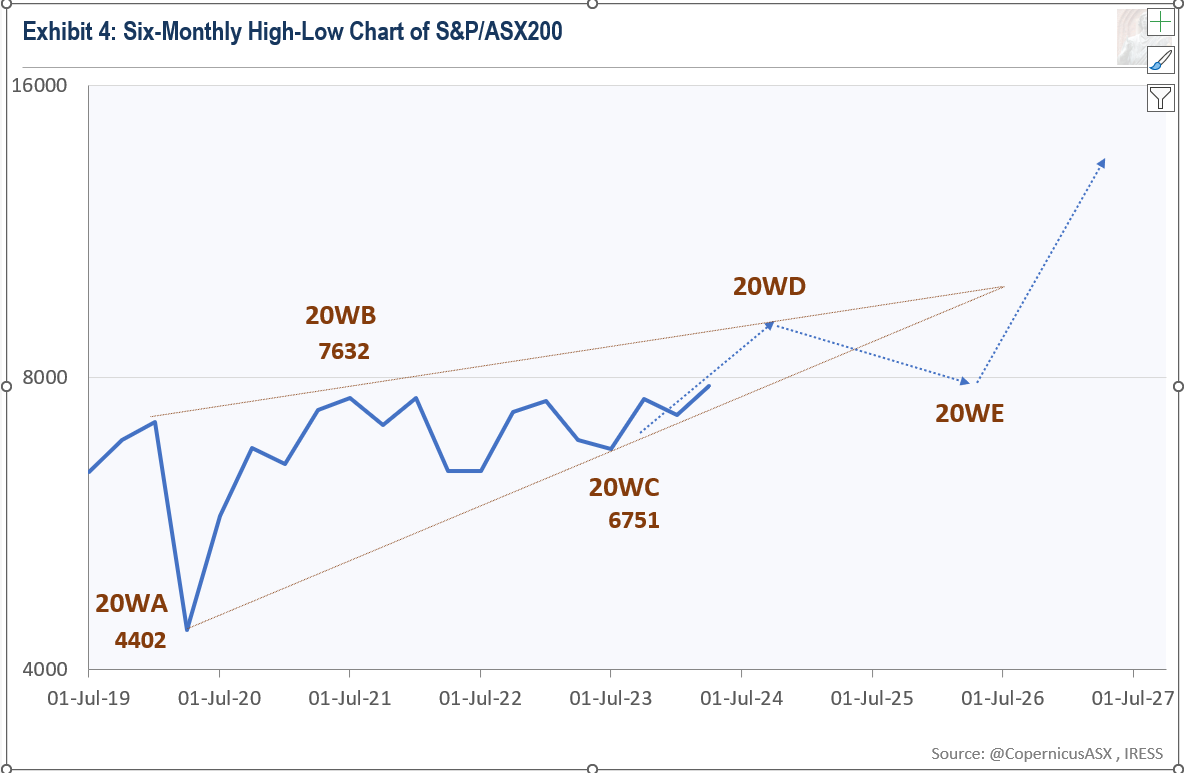
Wave Structure is consistent with a NEoWave Contracting Triangle (running variation) commencing in March 2020. Exhibit 5 below reveals more information about this price pattern.
There is sufficient evidence to confirm the likelihood that 20WD, Wave-D of the corrective price pattern that commenced in 2020, is currently underway.
The minimum measured move for 20WD is likely 8200 points. 20WD will likely finish in the second half of this year. The Monthly high-low chart hints at December 2024.
Wave Structure suggests the market could go as high as 8500 to 8700 this year, but the probability of that scenario has declined recently. I think it prudent to assume that 20WD will peter out somewhere between 8200 and 8500 points.
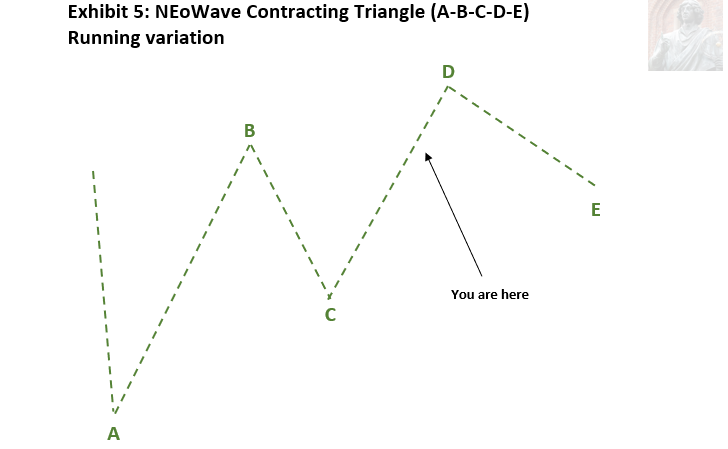
The NEoWave Contracting Triangle is a corrective price pattern that consists of five waves. It includes three trending waves (A, C, & E) and two countertrend waves (B & D). Each successive trending wave is smaller than the preceding trending wave, which is why it is called "contracting."
The “running” variation of a Contracting Triangle is rare. Both countertrend rallies are more substantial than the trending wave that they follow. Although they are larger in price, they move at a slower rate, which is why they are considered countertrend in nature. As a result, the correction happens "on the run". This pattern indicates a very strong (or weak if this price pattern occurs during a downtrend) market, and you can expect a significant move after the completion of the running Contracting Triangle.
Seasonality
For those interested in learning more about exogenous cycles and how they influence the Earth and its inhabitants, I recommend Stephen J. Puetz's book The Unified Cycle Theory: How Cycles Dominate the Structure of the Universe and Influence Life on Earth.
In the 1990s, Puetz studied a number of crashes throughout financial history and discovered an intriguing correlation. He noticed that these crashes followed a similar pattern in terms of their progression. The market would peak around the new moon prior to a solar eclipse. It would then decline into the solar eclipse, before bouncing to a secondary top (a lower high) around the time of a lunar eclipse. This would be followed by a panic that would last from two to eight weeks.1 There are slight variations in the pattern, but the common thread linking most crashes is that the panic begins around the time of a lunar eclipse or an adjacent full moon. Most blogs refer to this specific period as the Puetz crash window.
This study was a precursor to his extensive research on cycles and their effects on Earth and its inhabitants. He discovered several significant cycles for financial markets. Puetz contends that these external forces do not change how we think, but they influence how we feel. And feelings can catalyse trading behaviour, much to the chagrin of academics and fundamentalists.2
Geomagnetic activity is inversely correlated with market returns and is influenced by at least three short- to medium-term cycles.345 These cycles include the 182.625-day Geomagnetic Cycle, the 173.31-day Eclipse Cycle, and the 29.53-day Lunar Cycle.
The semi-annual Geomagnetic Cycle is the most important of these cycles. It refers to the changes in geomagnetic activity that occur throughout the year, with the highest activity around the equinoxes and the lowest around the solstices. Puetz suggests that this cycle is the primary influence on the seasonal pattern observed in financial markets. This cycle is reinforced when the Eclipse Cycle closely aligns with it.
The 173.31 Puetz Eclipse Cycle is an idealised cycle of price behaviour relative to eclipses. This cycle’s two most salient features are the peak around the new moon prior to the solar eclipse and the trough near the midpoint of the cycle. Every investor should note when the downward phase of the Eclipse Cycle overlaps with periods of seasonal weakness, which happen from January through March or August through October per the Geomagnetic Cycle. This becomes even more relevant when emotions are running high.
Last week, I mentioned that the new moon on March 10 at 20:00 was more “important than usual,” as it was the theoretical peak of the Puetz Eclipse Cycle. Both the Geomagnetic Cycle and the Eclipse Cycle are now pointed downwards in terms of their influence on share prices. While there is no evidence of a bubble or excess speculation in the price behaviour of the ASX 200, the Banks are definitely exhibiting emotional-like price behaviour. That is why I wrote last week that “it is possible that the pending top for this sector is highly significant and that banks will pull back much further than the ASX 200”.” I tweeted the possibility that Banks could fall by circa 17% on Monday.
The interplay of the semi-annual Geomagnetic Cycle and the Puetz Eclipse Cycle reinforces my forecast that we will see mild to moderate weakness for the ASX 200 through March and into April. I suspect the decline in the Banks will be more severe and that they could bottom much later, potentially in June, near the midpoint of the Puetz Eclipse Cycle.
Smart money
Exhibit 6 compares the ASX 200 with the Last Hour Index, a gauge of what participants with deep pockets (smart money) are doing. More details about this indicator can be found further below under the heading Lexicon.

The Last Hour Indicator declined this past week.
This indicator is on the bullish side of the ledger regarding its implications for the ASX 200 in the short to medium term.
Portfolio Management
While Wave Structure points to the likelihood of much higher prices for the ASX 200 over the next 6 to 9 months, this rally will likely be concentrated in fewer and fewer stocks as it progresses. It still makes sense to remain fully invested, but only in companies performing well from a price viewpoint.
Disclaimer
This market letter was prepared by Daniel Goulding and represents the views and opinions of the author. It does not constitute investment advice. My work is didactic in nature, serving to increase readers’ awareness of an alternative philosophy of financial markets. I write generally and cannot determine whether an investment is appropriate for your particular needs, individual circumstances or risk profile. You should consult a financial adviser if you require professional assistance with your portfolio. I am not licenced or affiliated with any licensee. Therefore, I am free to speak my mind.
Lexicon
Composite Advance-Decline Line (A-D Line): the cumulative total of the number of advancing issues (stocks that closed higher) less the number of declining issues (stocks that closed lower) each day. The A-D Line is the classic measure of market breadth – a term that describes how many stocks are participating in a market trend. When the majority of stocks are moving higher, this is reflected in a rising A-D Line. A declining A-D Line, on the other hand, indicates that the majority of stocks are moving lower.
Corrective price pattern: A reaction against the prevailing trend of one larger degree. Overlapping is a common feature although it is not a strict prerequisite. Corrections are an outgrowth of indecision or ambiguity with respect to the future. They are labelled alphabetically (A-B-C etc).
Elliott Wave Principle: the idea that market behaviour is self-affine in nature due to recurrent oscillations in public opinion across different but simultaneous timeframes. It posits that price action can be defined, quantified and classified, and used to project the future evolution of price.
Impulsive price pattern: A fast-moving market. Impulse waves produce a significant change in the price level. A distinctive feature is minimal or no overlapping, depicting a strong level of conviction about the outlook. They contain five segments labelled numerically (waves 1-2-3-4-5).
Last Hour Index: the cumulative measure of the net change in a share market index during the last hour of trade. The idea behind this indicator is that large market participants are most active in the last hour of trading when liquidity is at its zenith, as well as being the final opportunity for them to open or close positions ahead of the close of trade.
NEoWave: Neely Extensions of Elliott Wave. The body of knowledge enunciated by Glenn Neely, represents a significant break or extension of the original theory postulated by Ralph Elliott.
Price behaviour: the quantitative assessment of price action. Essentially, the largest, fastest moves are always in the direction of the prevailing psychological trend.
Wave structure: the quantitative relationship between different waves of price action.
Transmission time:
Sydney: 15-Mar-2024 16:18
Ljubljana: 15-Mar-2024 06:18
London: 15-Mar-2024 05:18
New York: 15-Mar-2024 00:18
The following list is not exhaustive. 1720 South Sea Bubble, 1929 Dow Utilities, 1980 Silver, 1987 Dow, 1987 NASDAQ, 1990 Nikkei, 1997 Hang Seng, 2017-2018 Bitcoin are some of the crashes that adhere to the typical pattern. 1637 Tulip Mania, 1980 Platinum, 2000 NASDAQ, 2015 China adhere to one of the key variations of the pattern where they peak and immediately start to crash around the time of the lunar eclipse full moon or adjacent full moon. 1929 Dow Industrials is the other key variation where it peaked on the penultimate new moon prior to the solar eclipse.
See, for example: Nikunj Patel & Martin Sewell, “Calendar anomalies: a survey of the literature”, International Journal of Behavioural Accounting and Finance 5, no. 2, (2015): 99-121.
Stephen Puetz, The unified cycle theory: How cycles dominate the structure of the universe and influence life on Earth (Denver: Outskirts Press, 2009).
Lifang Peng, Ning Li & Jingwen Pan, “Effect of Ap-Index of Geomagnetic Activity on S&P 500 Stock Market Return”, Advances in Astronomy 2019, https://doi.org/10.1155/2019/2748062.
Cesare Robotti & Anya Krivelyova, “Playing the Field: Geomagnetic Storms and the Stock Market”, Federal Reserve Bank of Atlanta Working Paper No. 2003-5b, (October 2003). http://dx.doi.org/10.2139/ssrn.375702