
ASX 200 Forecast 2024-Mar-23
ASX 200 Forecast 2024-Mar-23
Minor pullback in progress

Summary
Next 3 weeks
Lower to sideways. The risk-reward profile is skewed to the downside for the next three weeks.
Next 8 months
Significant rally. The ASX 200 will easily eclipse 8000 points and should move above 8200 points in the next 8 months.
2026
A new secular bull market, defined here as a significant multi-decade advance, will commence. Long-term wave structure and price behaviour suggest it will be the greatest bull market in the history of Australian equities.
Disclaimer: at end.
In the wake
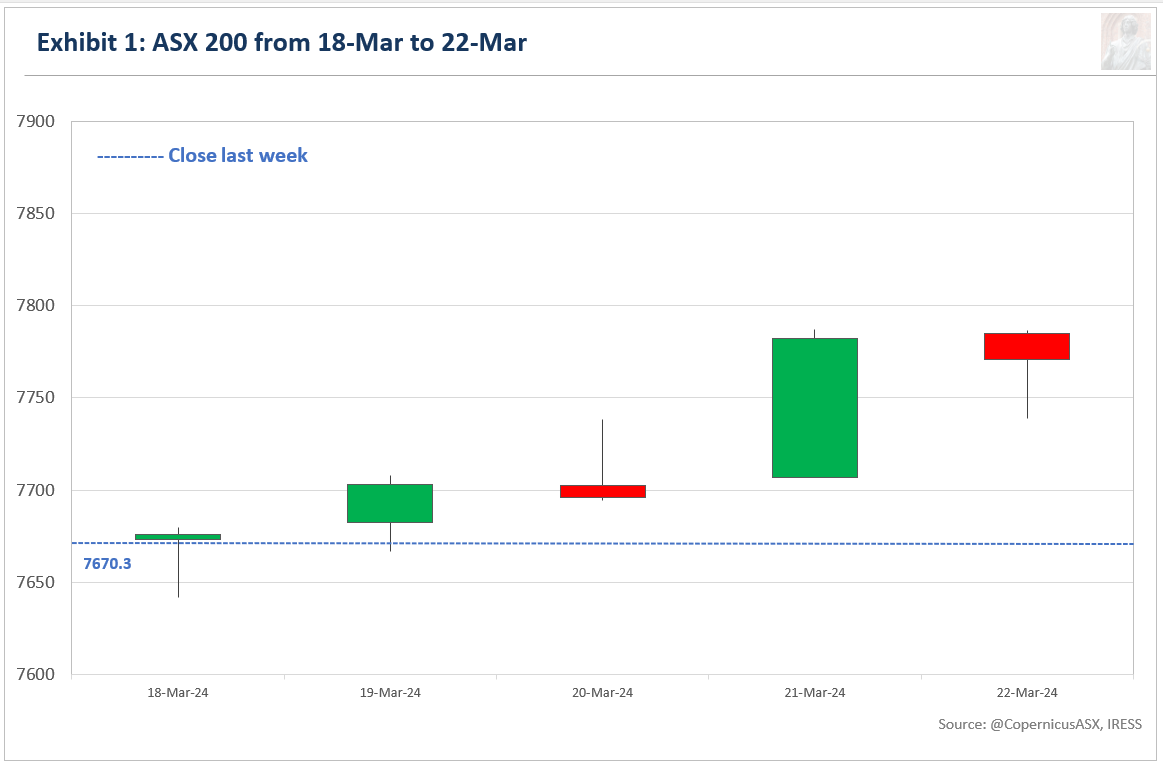
Australia's benchmark share market index, the S&P/ASX 200 (ASX 200), closed at 7770.6 points, gaining 100.3 points or 1.3% for the week.
Exhibit 1 illustrates the price movement for the ASX 200 during the past week.
Last week, I wrote:
Given this information, it is logical to assume that this pullback will be minimal in nature to allow it sufficient time and to be within striking distance of 8200 points. As a result, I think the ASX 200 will bottom somewhere around 7496 points in the next five weeks.
This week’s price action is consistent with the thesis of a minor pullback. If a more significant pullback were in progress, it would have been unlikely, but not impossible, for the market to have rallied as much as it did.
Around the Traps
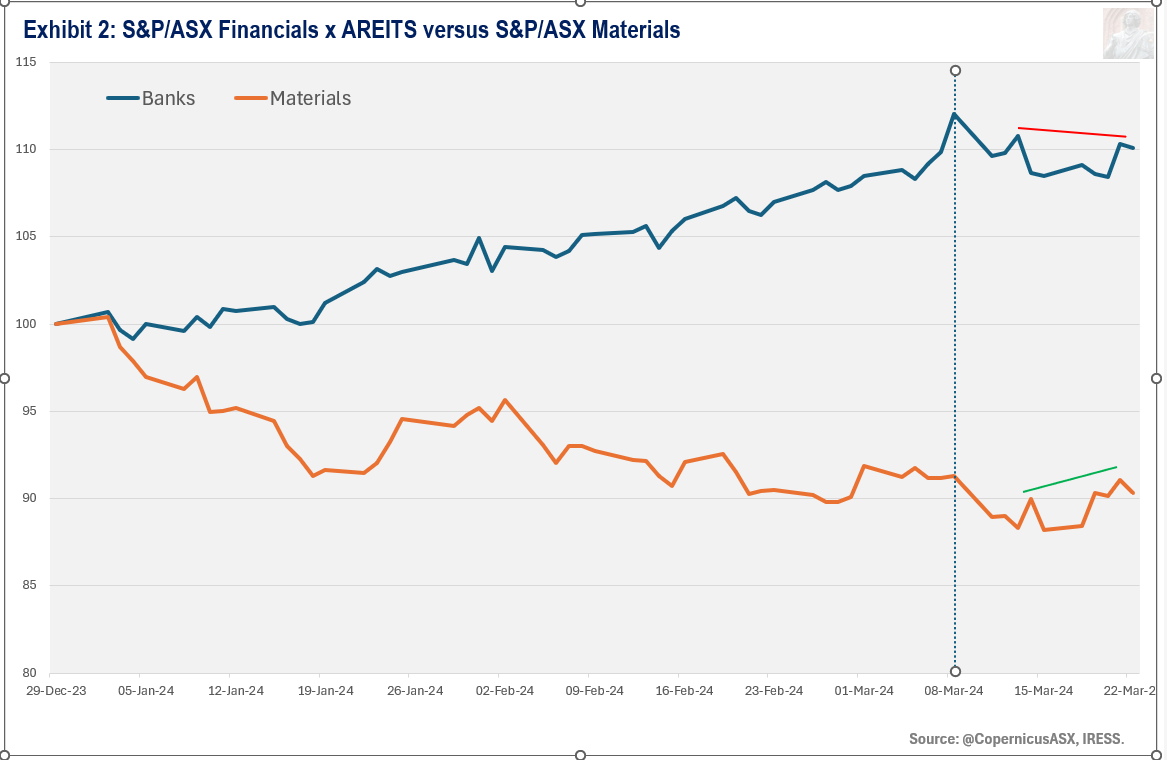
Exhibit 2 compares the Banking and Materials1 sectors since the start of 2024.
Last week, I wrote:
If this is a valid blow-off top for the Banks, this index will return to 7000 points, give or take 200 points. This would represent a circa 17% decline in about 3-5 months… I am 70% confident it is a blow-off top.
The decline since the 8 March top is progressing in a manner consistent with this forecast.
I also wrote that I expect:
A large rotation out of banks and into mining companies.
Since the ASX 200 peaked on 8 March (dotted line on the chart above), there is minor evidence of rotation. How Banks trade versus Materials during the next market decline will go a long way towards confirming this thesis.
Forecast
Exhibit 3 reveals the daily high-low chart for the ASX 200. A high-low chart plots the period's highs and lows in the order in which they occur.
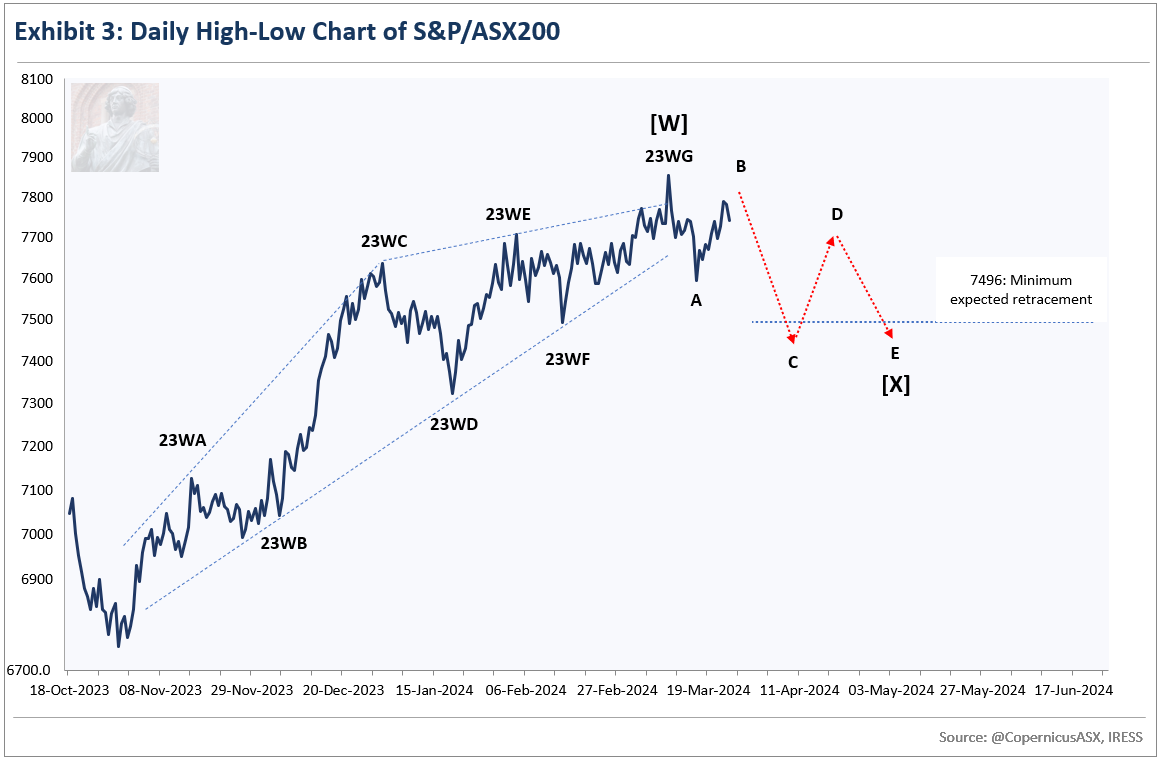
The rally from 6770.4 points on 31 October through 7853.1 points on 8 March, labelled 23WA through 23WG, is a textbook NEoWave Diametric. Five of the seven waves or segments tend towards equality in time, and there is obvious expansion through the first four segments of the pattern, followed by contraction for the last three segments.
The Diametric is the first segment of a larger pattern, labelled [W].
The current pullback—consolidation is the better term—is labelled [X]. It should be at least 1/3 of the price and time of the prior rally. This implies that the ASX 200 must decline to 7496 points at a minimum and that the consolidation will not be completed until at least 22 April.
The decline to 7591.4 points on 15 March is labelled A of [X]. The move higher this past week is labelled B of [X].
A tenet of NEoWave is that the largest, fastest moves occur in the direction of the prevailing trend. It is clear that B is a countertrend rally, as it is more complicated, time-consuming, and slower than A.
Even though B is a countertrend rally, it could potentially hit a marginal new high. A B-wave that retraces all of an A-wave implies future strength, which is consistent with what the six-month high-low charts tell us. But we also know that 7496 is the likely minimum downside target in the short term, which implies that any potential new highs will be marginal.
[X] is likely unfolding as a NEoWave Neutral Triangle (A-B-C-D-E). In this Corrective Price Pattern, C is the longest of the trending waves (A, C and E).
B will top around current levels sometime soon. C is likely to move below the minimum downside target of 7496 points.
The risk-reward profile is skewed to the downside for the next two to three weeks. The most likely scenario is that B tops around 7800, with C declining to around 7439 points.
Exhibit 4 reveals the six-monthly high-low chart for the ASX 200.
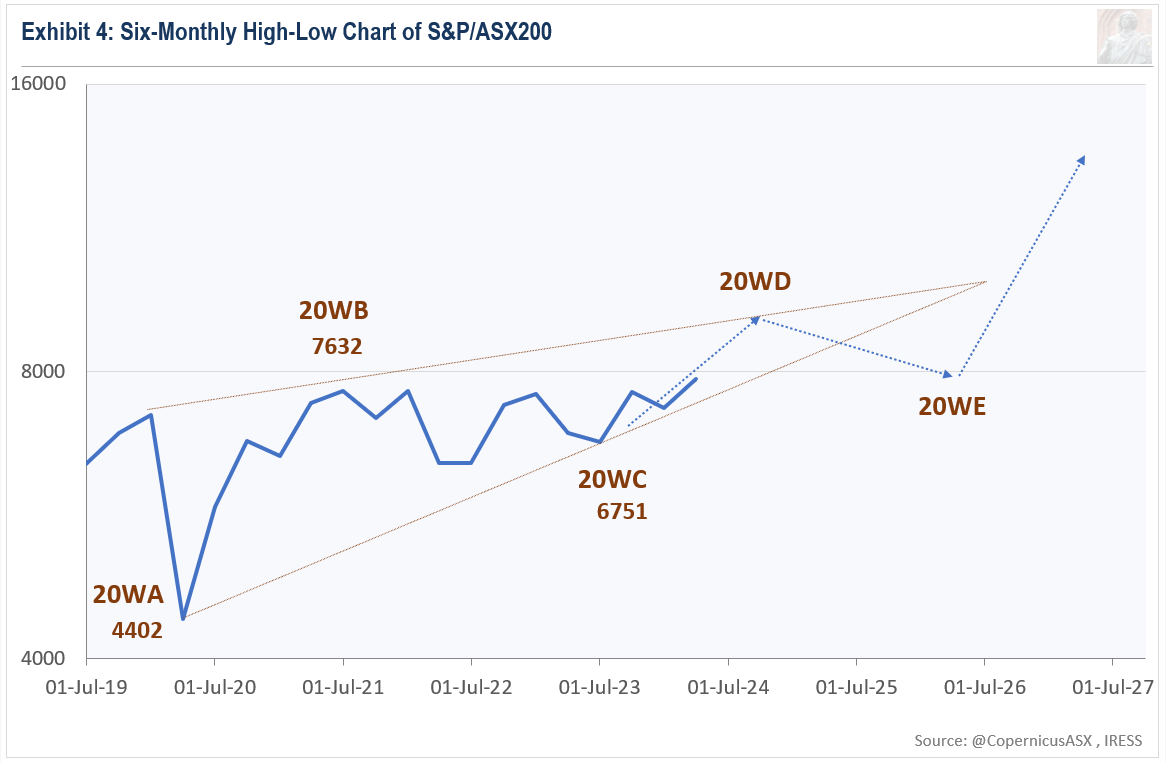
Wave Structure is consistent with a NEoWave Contracting Triangle (running variation) commencing in March 2020. Exhibit 5 below reveals more information about this price pattern.
There is sufficient evidence to confirm the likelihood that 20WD, Wave-D of the Corrective Price Pattern that commenced in 2020, is currently underway.
The minimum measured move for 20WD is likely 8200 points. 20WD will likely finish in the second half of this year. The Monthly high-low chart hints at December 2024.
Wave Structure suggests the market could go as high as 8500 to 8700 this year, but the probability of that scenario has declined recently. I think it prudent to assume that 20WD will peter out somewhere between 8200 and 8500 points.
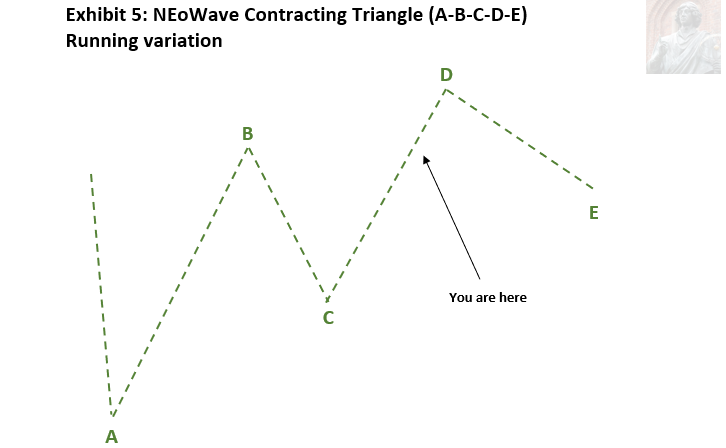
The NEoWave Contracting Triangle is a corrective price pattern that consists of five waves. It includes three trending waves (A, C, & E) and two countertrend waves (B & D). Each successive trending wave is smaller than the preceding trending wave, which is why it is called "contracting."
The “running” variation of a Contracting Triangle is rare. Both countertrend rallies are more substantial than the trending wave that they follow. Although they are larger in price, they move at a slower rate, which is why they are considered countertrend in nature. As a result, the correction happens "on the run". This pattern indicates a very strong (or weak if this price pattern occurs during a downtrend) market, and you can expect a significant move after the completion of the running Contracting Triangle.
Seasonality
Last week, I wrote about the semi-annual Geomagnetic Cycle and the Puetz Eclipse Cycle. Both cycles are exerting downward pressure on prices through March and into April.
When emotions are running high, these cycles become much more significant.
The Banks are most vulnerable because they have exhibited emotional-like behaviour since November last year. They peaked on 8 March, two days before the theoretical peak of the Puetz Eclipse Cycle.
Looking further afield, cryptocurrencies and US semiconductor stocks are also vulnerable. Bitcoin peaked on 14 March, Ethereum on 12 March, and semiconductors on 8 March.
Market internals (Vital signs)
Exhibit 6 compares the ASX 200 with the Composite Advance-Decline Line (A-D Line), the classic measure of market breadth (how many stocks are participating in a market trend). More details about this indicator can be found further below under the heading Lexicon.
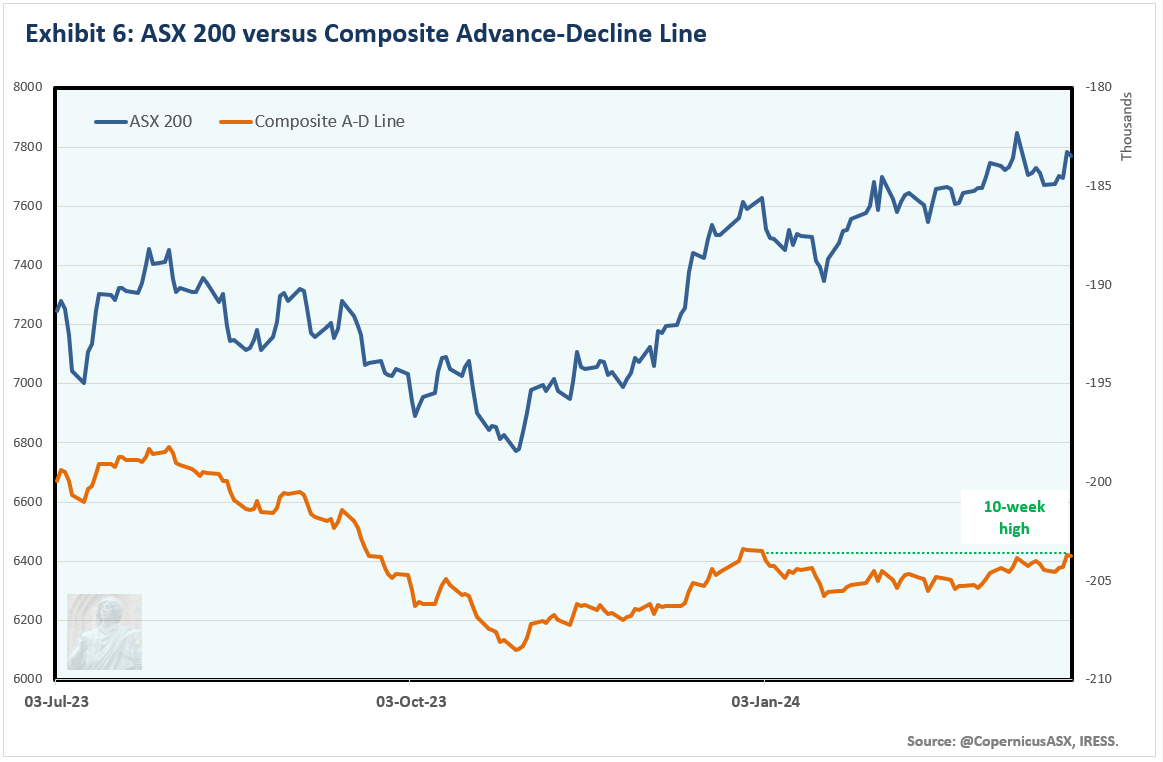
The Composite AD Line rallied this week, hitting a 10-week high!
This indicator is on the bullish side of the ledger, implying the likelihood of further gains for the ASX 200 in the short to medium term.
Smart money
Exhibit 7 compares the ASX 200 with the Last Hour Index, a gauge of what participants with deep pockets (smart money) are doing. More details about this indicator can be found further below under the heading Lexicon.
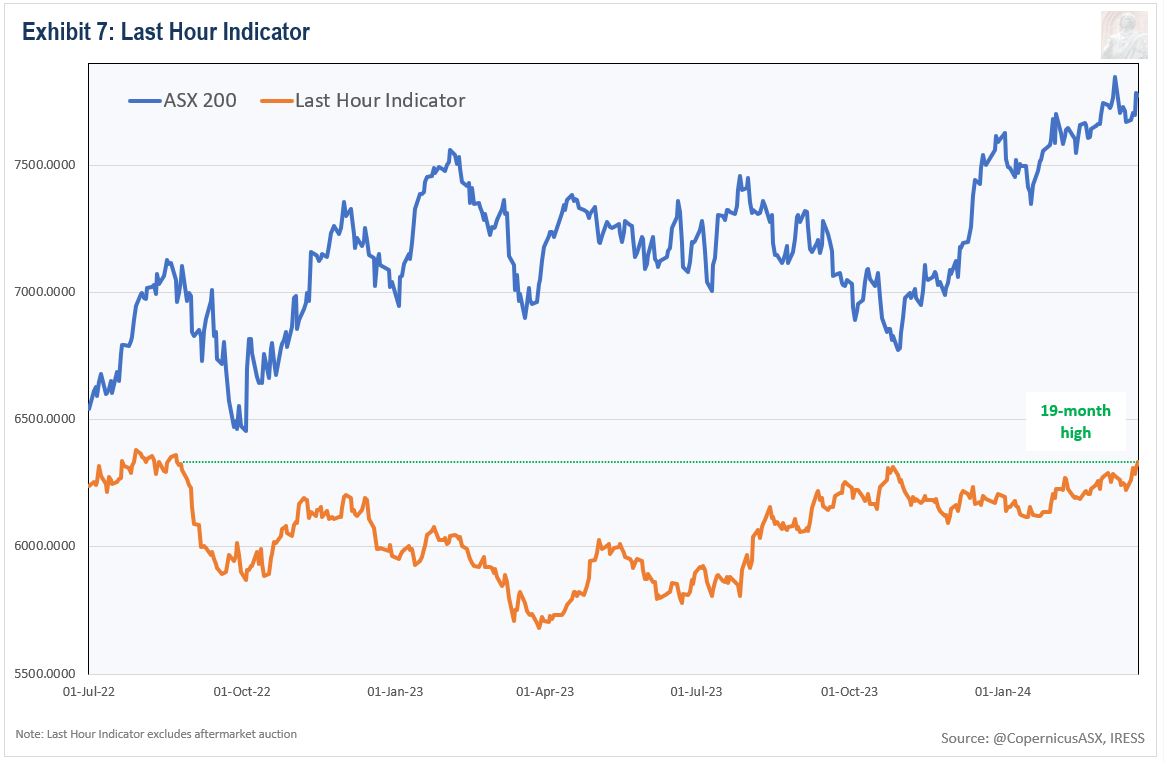
The Last Hour Indicator rallied this past week, hitting a 19-month high!
This indicator is on the bullish side of the ledger, implying the likelihood of further gains for the ASX 200 in the medium term.
Portfolio Management
While Wave Structure points to the likelihood of much higher prices for the ASX 200 over the next 6 to 8 months, this rally will likely be concentrated in fewer and fewer stocks as it progresses. It still makes sense to remain fully invested, but only in companies performing well from a price viewpoint.
Disclaimer
This market letter was prepared by Daniel Goulding and represents the views and opinions of the author. It does not constitute investment advice. My work is didactic in nature, serving to increase readers’ awareness of an alternative philosophy of financial markets. I write generally and cannot determine whether an investment is appropriate for your particular needs, individual circumstances or risk profile. You should consult a financial adviser if you require professional assistance with your portfolio. I am not licenced or affiliated with any licensee. Therefore, I am free to speak my mind.
Lexicon
Composite Advance-Decline Line (A-D Line): the cumulative total of the number of advancing issues (stocks that closed higher) less the number of declining issues (stocks that closed lower) each day. The A-D Line is the classic measure of market breadth – a term that describes how many stocks are participating in a market trend. When the majority of stocks are moving higher, this is reflected in a rising A-D Line. A declining A-D Line, on the other hand, indicates that the majority of stocks are moving lower.
Corrective price pattern: A reaction against the prevailing trend of one larger degree. Overlapping is a common feature although it is not a strict prerequisite. Corrections are an outgrowth of indecision or ambiguity with respect to the future. They are labelled alphabetically (A-B-C etc).
Elliott Wave Principle: the idea that market behaviour is self-affine in nature due to recurrent oscillations in public opinion across different but simultaneous timeframes. It posits that price action can be defined, quantified and classified, and used to project the future evolution of price.
Impulsive price pattern: A fast-moving market. Impulse waves produce a significant change in the price level. A distinctive feature is minimal or no overlapping, depicting a strong level of conviction about the outlook. They contain five segments labelled numerically (waves 1-2-3-4-5).
Last Hour Index: the cumulative measure of the net change in a share market index during the last hour of trade. The idea behind this indicator is that large market participants are most active in the last hour of trading when liquidity is at its zenith, as well as being the final opportunity for them to open or close positions ahead of the close of trade.
NEoWave: Neely Extensions of Elliott Wave. The body of knowledge enunciated by Glenn Neely, represents a significant break or extension of the original theory postulated by Ralph Elliott.
Price behaviour: the quantitative assessment of price action. Essentially, the largest, fastest moves are always in the direction of the prevailing psychological trend.
Wave structure: the quantitative relationship between different waves of price action.
Transmission time:
Sydney: 23-Mar-2024 00:46
Ljubljana: 22-Mar-2024 14:46
London: 22-Mar-2024 13:46
New York: 22-Mar-2024 08:46