
ASX 200 Forecast 2024-Apr-05
ASX 200 Forecast 2024-Apr-05
Continuation of decline

Summary
Next 2 weeks
Lower. The risk-reward profile is skewed to the downside for the next two weeks.
Next 8 months
Significant rally. The ASX 200 will easily eclipse 8000 points and should move above 8200 points in the next 8 months.
2026
A new secular bull market, defined here as a significant multi-decade advance, will commence. Long-term wave structure and price behaviour suggest it will be the greatest bull market in the history of Australian equities.
Disclaimer: at end.
In the wake
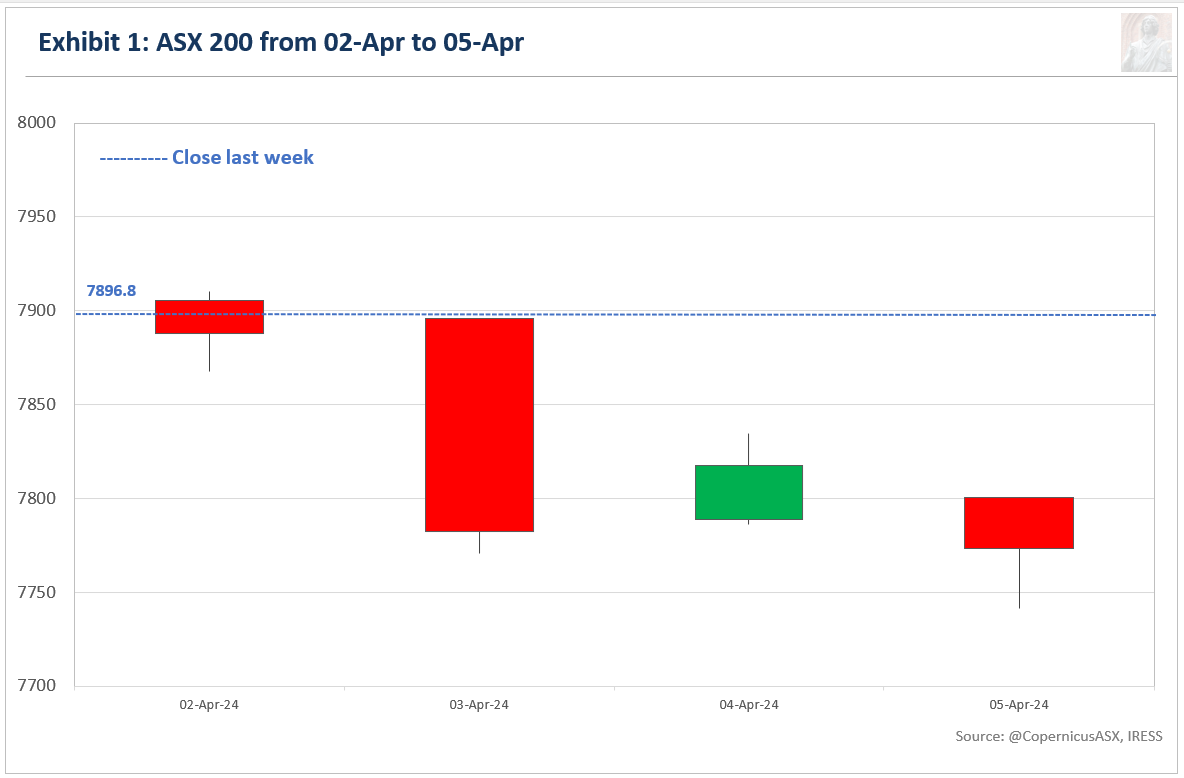
Australia's benchmark share market index, the S&P/ASX 200 (ASX 200), closed at 7773.3 points, losing 123.6 points or 1.6% for the week.
Exhibit 1 illustrates the price movement for the ASX 200 during the past week.
Last week, I wrote:
The current rally move is either on the verge of completion or topped on Thursday. The risk-reward profile is skewed to the downside, with the ASX 200 likely to decline by about 4.5% to 5.3% in the next two to three weeks.
The ASX 200 behaved exactly as anticipated, which reinforces the likelihood that the forecast for price action over the next month is correct.
Around the Traps
Exhibit 2 compares the Banking and Materials1 sectors since the start of 2024.
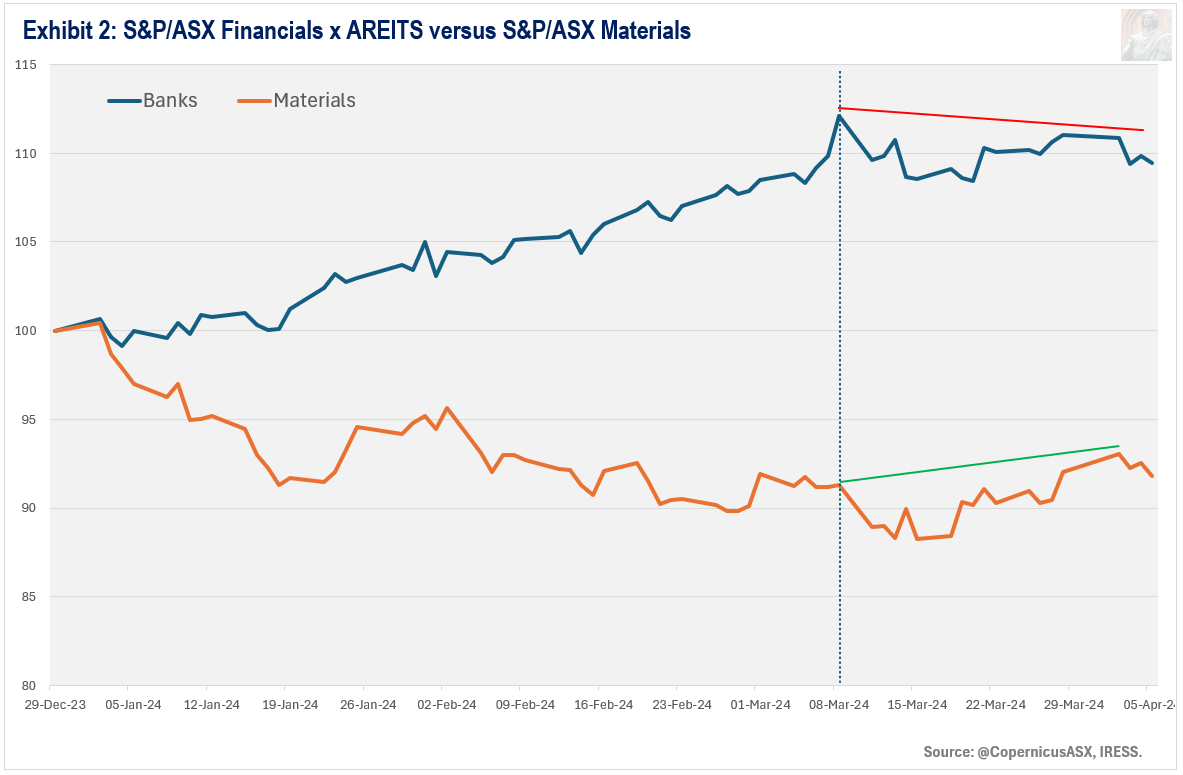
Three weeks ago, I wrote that I expect:
A large rotation out of banks and into mining companies.
The Materials (mining and related companies) sector is clearly outperforming the S&P/ASX 200 Financials Ex A-REIT index (I refer to this index as the Banks since the four major banks comprise two-thirds of it). This is where investors should focus their energies if they want to take advantage of the next significant rally in the ASX 200.
Three weeks ago, I also wrote:
If this is a valid blow-off top for the Banks, this index will return to 7000 points, give or take 200 points. This would represent a circa 17% decline in about 3-5 months… I am 70% confident it is a blow-off top.
Price action remains consistent with the thesis that the 8 March high was a multi-month or multi-year top for the Banks, probably the latter. Even though I expect another significant rally for the ASX 200 over the coming 5 to 8 months, the Banks will be a laggard.
Forecast
Exhibit 3 reveals the daily high-low chart for the ASX 200. A high-low chart plots the period's highs and lows in the order in which they occur.
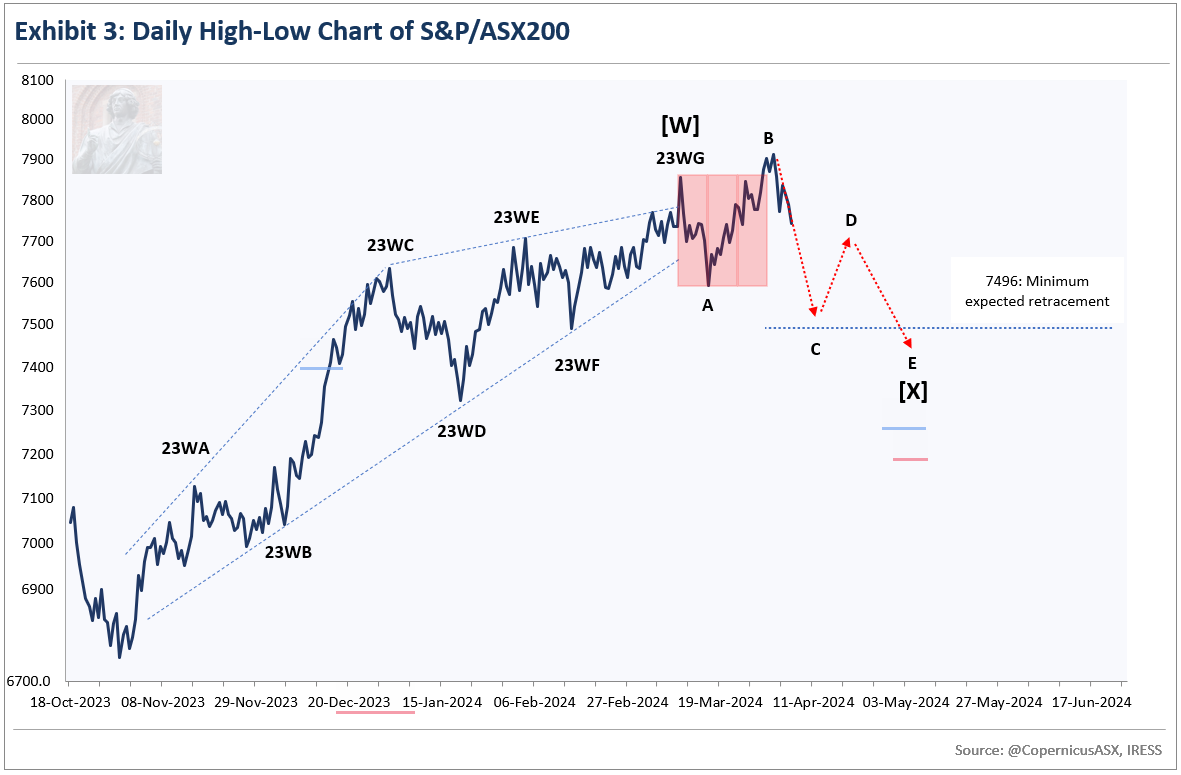
Last week, I wrote:
According to the typical parameters for a Neutral Triangle, B is unlikely to move much higher as its likely maximum limit is 7953 points. Furthermore, considering time, B should be close to completion as waves tend to be more similar rather than dramatically different in Triangles.
On Monday, the ASX 200 printed a marginal new high of 7910.5 points before beginning what looks to be a meaningful decline. The decline is following the expected price trajectory, so there is no need to revise the current interpretation or price forecast.
[X] appears to be unfolding as a NEoWave Neutral Triangle (A-B-C-D-E). This Corrective Price Pattern consists of five waves or segments labelled alphabetically (A-B-C-D-E). It consists of three trending (A, C, and E) and two non-trending (B and D) waves. Wave-C is the longest of the trending waves; it is typically related to Wave-A by around 138%, though it can be as short as 101% or as long as 261%. The typical maximum limit for B is around 138% of A.
C will likely be between 101% to 161% of A, which projects a probable range of 7489 to 7646 points. Interestingly, the probable range's minimum value, 7489 points, is just below the likely minimum expected target of 7496 points for [X]. Therefore, it is possible that C achieves the likely minimum target and that E traces out a higher low, rather than a marginal new low per the forecast above.
Because A and B are different in time, we can project the completion date for C by taking the average time of A plus B. This calculation suggests 12 April. Now, this relationship doesn’t always work as well in Triangles as it does in other Corrective Price Patterns, but nevertheless, it should give us an excellent approximation.
At current levels, the risk-reward profile remains skewed to the downside. Potential upside is marginal (less than 1% at best). It is probable that the ASX 200 will experience a decline of around 1.6% to 3.7% in the next one to two weeks.
Exhibit 4 reveals the six-monthly high-low chart for the ASX 200.
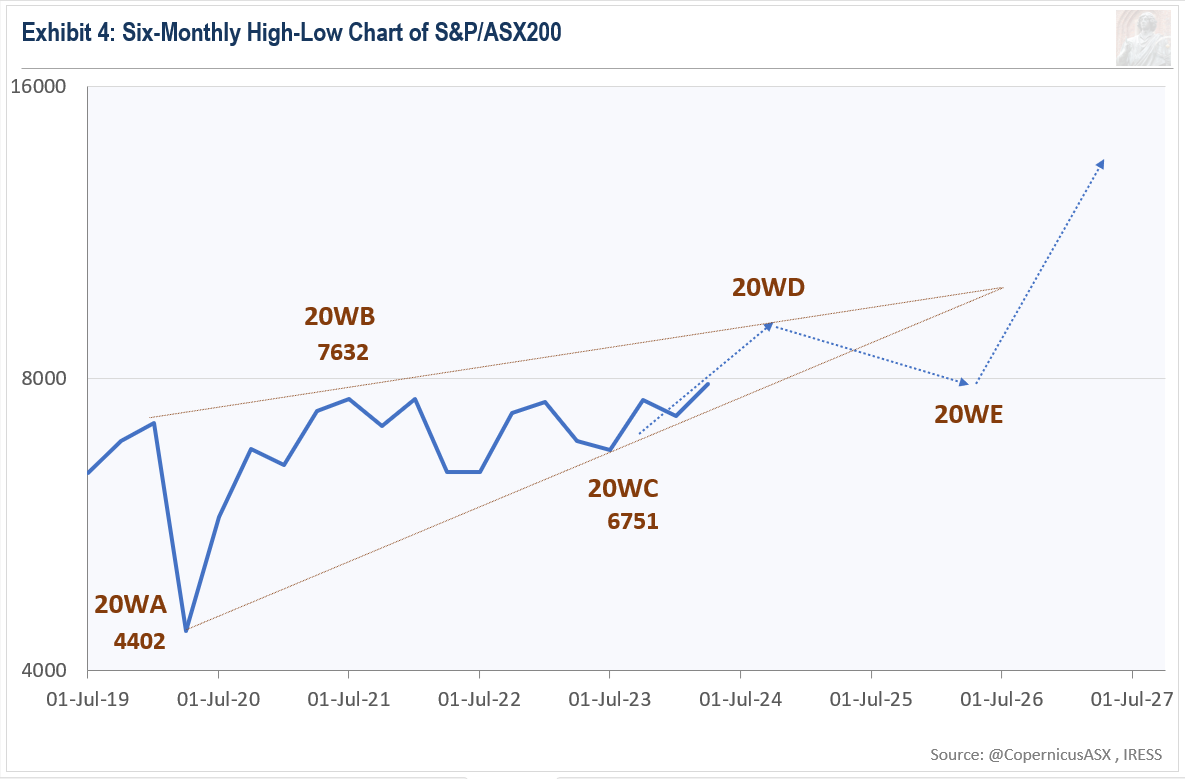
Wave Structure is consistent with a NEoWave Contracting Triangle (running variation) commencing in March 2020. Exhibit 5 below reveals more information about this price pattern.
There is sufficient evidence to confirm the likelihood that 20WD, Wave-D of the Corrective Price Pattern that commenced in 2020, is currently underway.
The minimum measured move for 20WD is likely 8200 points. 20WD will likely finish in the second half of this year. The Monthly high-low chart hints at December 2024.
Wave Structure suggests the market could go as high as 8500 to 8700 this year, but the probability of that scenario has declined recently. I think it prudent to assume that 20WD will peter out somewhere between 8200 and 8500 points.
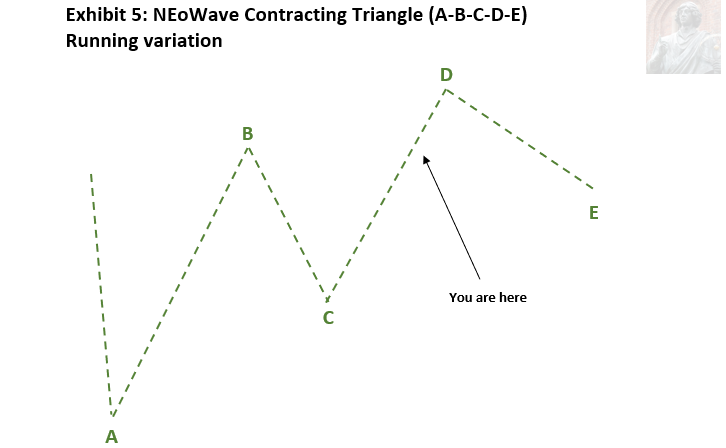
The NEoWave Contracting Triangle is a corrective price pattern that consists of five waves. It includes three trending waves (A, C, & E) and two countertrend waves (B & D). Each successive trending wave is smaller than the preceding trending wave, which is why it is called "contracting."
The “running” variation of a Contracting Triangle is rare. Both countertrend rallies are more substantial than the trending wave that they follow. Although they are larger in price, they move at a slower rate, which is why they are considered countertrend in nature. As a result, the correction happens "on the run". This pattern indicates a very strong (or weak if this price pattern occurs during a downtrend) market, and you can expect a significant move after the completion of the running Contracting Triangle.
Seasonality
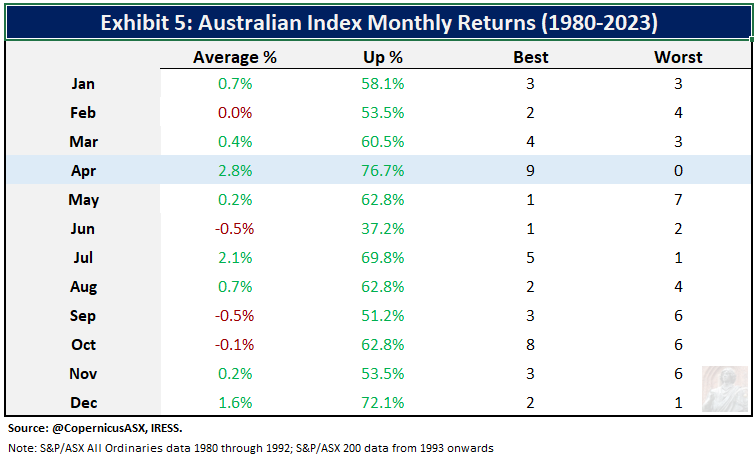
Exhibit 5 reveals monthly seasonality data for Australian equities.
No matter how you slice and dice the data, April is by far the best month of the year to own Australian shares. It is up more than three-quarters of the time, producing an average gain of 2.8%. From 1980 onwards, it has been the best month of the year nine times.
Following the work of Stephen J. Puetz, I believe the reason why April is such a strong month is due to the connection between geomagnetism and risk-taking behaviour. Geomagnetic activity is inversely correlated with market returns and is influenced by at least four short- to medium-term cycles.345 These cycles include the 182.625-day Geomagnetic Cycle, the 173.31-day Eclipse Cycle, the 29.53-day Lunar Cycle and the short-term Sunspot Cycle with an average periodicity of 27 days.
The semi-annual Geomagnetic Cycle is the most important of these cycles, with Puetz suggesting that it is the primary influence on the seasonal pattern observed in financial markets. This cycle refers to the changes in geomagnetic activity that occur throughout the year, with the highest activity around the equinoxes (March, September) and the lowest around the solstices (June, December).
The March equinox occurs around 20 March each year. As a technical analyst, I always have this date marked on my calendar. I become extremely interested when markets are trending lower and emotions are running high.
In March last year, when investors were frightful of a banking contagion following the collapse of Silicon Valley Bank in the US and Credit Suisse, a global systemically important bank, announcing material lapses in their risk protocols, I calmly noted that March was a bear market killer and expected a significant rally into and through April, which materialized as expected.
While I am one of the strongest proponents of seasonality in financial markets, I believe those betting on a strong April this year will likely be frustrated. There are two reasons for this stance. The first is Wave Structure, which suggests the current consolidation or mild pullback won’t likely end till 22 April at the earliest. The second is the Puetz Eclipse Cycle. As this cycle is coming at the tail end of the seasonally weak period, it is possible that the typical seasonal strength that emerges in late March and runs through the entire month of April is postponed by a few weeks. This gels closely with the Solunar forecast for 2024.
The solunar model suggests the typical mid-March bottom will occur in early April. It also suggests that September and October this year will defy the typical malaise they usually experience.
Daniel Goulding, The Seasonal Outlook for 2024, FNArena, December 19, 2023.
Per the Puetz Eclipse Cycle, equity markets tend to peak around the time of a new moon prior to the solar eclipse. A modest wave of selling then ensues that lasts until the time of the solar eclipse. A respite in selling follows. Markets stage a modest recovery over the next two weeks, till around the time of a full moon, which is also a lunar eclipse, or four weeks from one. At that point, a panic or significant wave of selling emerges that lasts at least two to three weeks.
The Puetz Eclipse Cycle can largely be ignored most of the time. There are times, however, when investors should pay close attention. These instances include when markets are exhibiting manic, topping, or bear market behaviour and when the negative phase of the Eclipse Cycle coincides with the negative phase of the semi-annual Geomagnetic Cycle. While these two cycles are not perfectly synchronised at present, neither are they out of step, so we should not ignore the possibility of unexpected seasonal weakness in April.
Now, I am not concerned about equity markets in general as they are not displaying any signs of topping, manic or bear market behaviour. But if we drill down into the individual sectors, Aussie Banks and US semiconductor stocks are vulnerable. In terms of asset classes, cryptocurrencies, which I believe are an excellent leading indicator of global risk appetite, are clearly vulnerable.
Last week I wrote:
Cryptocurrencies are also very vulnerable. Both Bitcoin and Ethereum have exhibited emotional price behaviour since October last year. Bitcoin peaked on 14 March, and Ethereum on 12 March. From a NEoWave viewpoint, the trend is clearly down for both currencies on the daily and weekly high-low charts. Moreover, price action in Ethereum appears to be unfolding as a textbook example of the Puetz Eclipse Cycle. Another large decline in cryptos in the next few weeks should not come as a surprise.
Bitcoin and Ethereum dropped 10% and 12%, respectively, over the past five days. It's likely they will head lower for a few more days before a respite in selling. If the Eclipse Cycle is at play here, the real decline will start in two to three weeks from now. If there is enough interest, I will prepare a special edition of The Goulding Letter, which will examine the reasonable probability of a significant decline in the cryptocurrency space in mid-to late April.
Smart money
Exhibit 6 compares the ASX 200 with the Last Hour Index, a gauge of what participants with deep pockets (smart money) are doing. More details about this indicator can be found further below under the heading Lexicon.
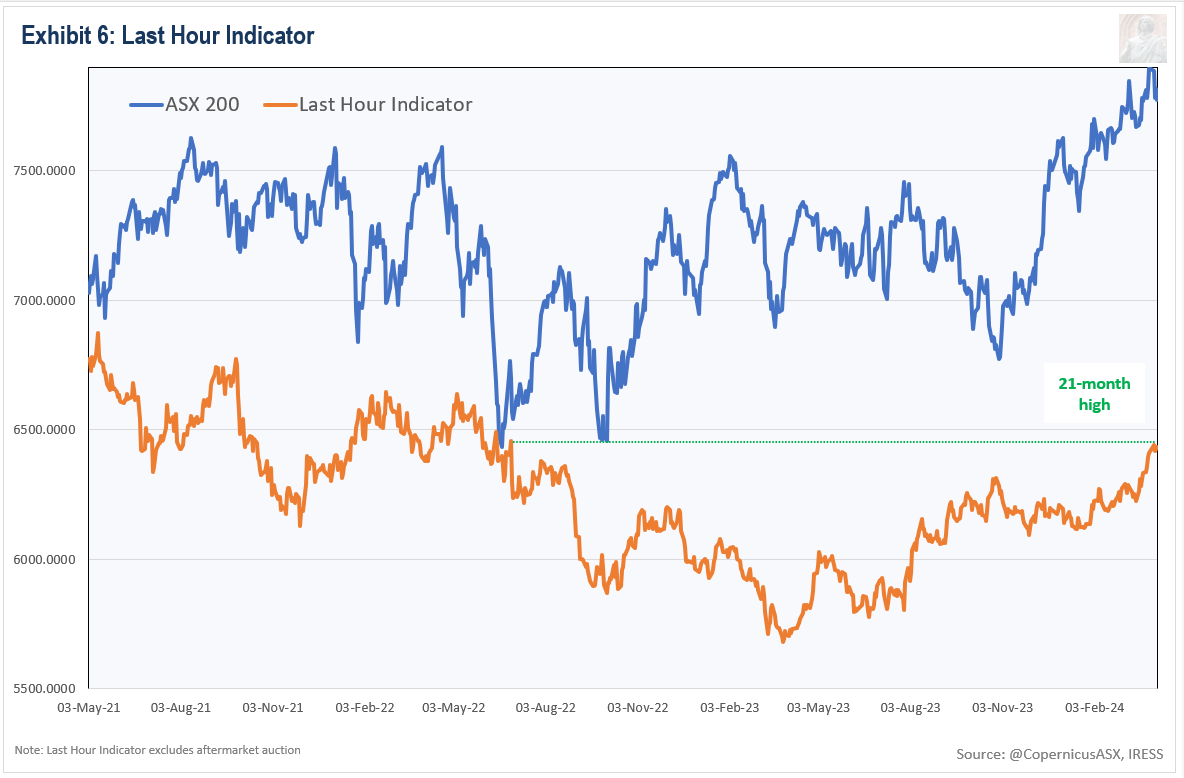
The Last Hour Indicator rallied this past week, hitting a fresh 21-month high!
This indicator is on the bullish side of the ledger, implying the likelihood of further gains for the ASX 200 in the short to medium term.
Portfolio Management
While Wave Structure points to the likelihood of much higher prices for the ASX 200 over the next 5 to 8 months, this rally will likely be concentrated in fewer and fewer stocks as it progresses. It still makes sense to remain fully invested, but only in companies performing well from a price viewpoint.
Disclaimer
This market letter was prepared by Daniel Goulding and represents the views and opinions of the author. It does not constitute investment advice. My work is didactic in nature, serving to increase readers’ awareness of an alternative philosophy of financial markets. I write generally and cannot determine whether an investment is appropriate for your particular needs, individual circumstances or risk profile. You should consult a financial adviser if you require professional assistance with your portfolio. I am not licenced or affiliated with any licensee. Therefore, I am free to speak my mind.
Lexicon
Composite Advance-Decline Line (A-D Line): the cumulative total of the number of advancing issues (stocks that closed higher) less the number of declining issues (stocks that closed lower) each day. The A-D Line is the classic measure of market breadth – a term that describes how many stocks are participating in a market trend. When the majority of stocks are moving higher, this is reflected in a rising A-D Line. A declining A-D Line, on the other hand, indicates that the majority of stocks are moving lower.
Corrective price pattern: A reaction against the prevailing trend of one larger degree. Overlapping is a common feature although it is not a strict prerequisite. Corrections are an outgrowth of indecision or ambiguity with respect to the future. They are labelled alphabetically (A-B-C etc).
Elliott Wave Principle: the idea that market behaviour is self-affine in nature due to recurrent oscillations in public opinion across different but simultaneous timeframes. It posits that price action can be defined, quantified and classified, and used to project the future evolution of price.
Impulsive price pattern: A fast-moving market. Impulse waves produce a significant change in the price level. A distinctive feature is minimal or no overlapping, depicting a strong level of conviction about the outlook. They contain five segments labelled numerically (waves 1-2-3-4-5).
Last Hour Index: the cumulative measure of the net change in a share market index during the last hour of trade. The idea behind this indicator is that large market participants are most active in the last hour of trading when liquidity is at its zenith, as well as being the final opportunity for them to open or close positions ahead of the close of trade.
NEoWave: Neely Extensions of Elliott Wave. The body of knowledge enunciated by Glenn Neely, represents a significant break or extension of the original theory postulated by Ralph Elliott.
Price behaviour: the quantitative assessment of price action. Essentially, the largest, fastest moves are always in the direction of the prevailing psychological trend.
Wave structure: the quantitative relationship between different waves of price action.
Transmission time:
Sydney: 05-Apr-2024 18:31
Ljubljana: 05-Apr-2024 09:31
London: 05-Apr-2024 08:31
New York: 05-Apr-2024 03:31