


ASX 200 Forecast 2024-Dec-27
Downtrend confirmed.

Disclaimer: This market letter represents the views and opinions of the author. It does not constitute investment advice. It is my online journal to share knowledge of an alternative philosophy of financial markets and how I use this philosophy to trade. You should consult a financial adviser if you require professional assistance with your portfolio. I am not a financial adviser.
A link to an article I wrote for FNArena, “As good as it gets for Australian Equities.”
Summary
A new downtrend has been confirmed.
Following this peak, a 2–3-year bear market will take place. From peak to trough, the decline will likely be around 24%.
Sometime in 2027 or 2028, a new secular bull market will commence, defined here as a significant multi-decade advance. Wave Structure suggests it will be the greatest bull market in the history of Australian equities.
An abbreviated Christmas edition.
Forecast
Exhibit 2 depicts the prevailing interpretation of price behaviour on the weekly high-low chart for the ASX 200.1

I have made a minor adjustment to the anticipated price trajectory.
The best explanation of price behaviour from late 2023 is a NEoWave Contracting Triangle, a corrective price pattern consisting of five segments or waves labelled alphabetically (A-B-C-D-E). Appendix One provides a deep dive into this price pattern.
23WD will likely bottom somewhere between 7500 and 7700 points in late 1Q2025 or early 2Q2025.
If a NEoWave Contracting Triangle is a valid interpretation, 23WD should alternate with 23WB in as many ways as possible. Alternation can occur via the following: price, time, the severity of retracement of the prior wave, complexity (essentially how many up and down moves comprise the wave) and construction (each leg of a triangle will consist of its own price pattern/s).
A cursory glance of 23WB reveals that it was a shallow correction that unfolded in a sideways manner. 23WD is, therefore, likely to unfold in more of a directional downward manner with a severe retracement of the prior wave, 23WC. And because longer-term Wave Structure suggests the risk is skewed sideways to downwards over the next few years, 23WD could temporarily breach the start of 23WC at 7628.1 points.2
With this in mind, the forecast price range for the low of 23WD is set at 7500 to 7700 points.
Regarding time, since 23WB and 23WC are very different in duration, 23WD is likely to be the average of these two waves, which suggests a duration of circa 18-19 weeks.3 This points to the end of March or early April as the ideal time conclusion for 23WD.
Exhibit 3 depicts the interpretation of price behaviour on the daily high-low chart for the ASX 200.
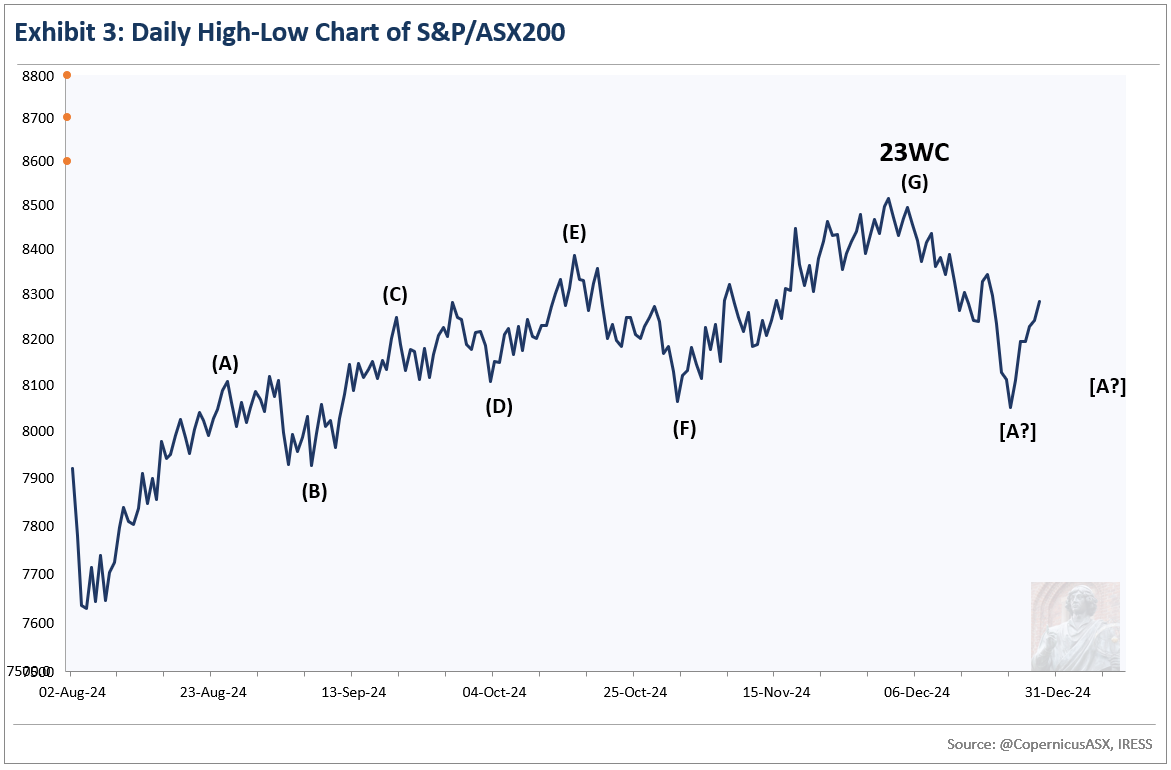
Last week I wrote:
Given what I am seeing, I suspect this first move of the downtrend is close to completion in terms of time and, hopefully, price.
An immediate rebound followed.
If I had to guess what is happening, I would choose a NEoWave Neutral Triangle (A-B-C-D-E).
The first trending wave, [A] has likely bottomed in price, but probably not completed. I suspect there will be one or two higher lows to complete [A] before a much bigger countertrend rally [B] commences. Once [B] completes, the next trending wave to the downside, [C], will commence. I think [C] will be the largest wave of the price pattern and probably represent the low of the pattern, too.
I have not drawn the anticipated trajectory on the daily high-low chart for two reasons. First, it is Christmas and I have better things to do with my time. Second, another week of trading should be sufficient for me to boil down the future to one or two likely possibilities.
Risk Management
The target range over the next few months is 7500-7700 points.
Investment accounts
On December 3, I finished the sale of all non-core holdings, retaining some quality and speculative stocks for the medium to long term.
I have yet to hedge the downside risk with respect to the remaining stocks.
Trading Accounts
I am still levered long the ASX 200. With confirmation of a new downtrend, I will be looking to jettison these longs over the next few weeks, etching out hopefully a small profit and will then establish a short position.
For a recap on the Santa Claus Rally, which commenced officially on Monday, see my article Santa Claus Down Under - FNArena.com.
Appendix One

The NEoWave Contracting Triangle is a corrective price pattern consisting of five segments or waves: three trending waves labelled A, C, and E, and two countertrend waves, B and D.
Each successive trending wave is smaller than the preceding one, hence the designation "contracting".
PRICE
Wave-A is a significant violent move. It is usually the longest leg of the triangle.
Wave-B should retrace at least 33-38.2% of wave-A. It usually retraces around 80%. In some instances, wave-B can be the longest wave of the triangle.
The ideal price conclusion of wave-C is 61.8% of wave-A. In some instances, when this wave reaches the highest point of the price pattern, it will extend past the ideal price conclusion by a margin.
Wave-D should retrace at least 33-38.2% of Wave-C. It usually retraces 61.8% or more. It should alternate with wave-B in as many ways as possible. Alternation can occur via the following: price, time, the severity of retracement of the prior wave, complexity (essentially how many up and down moves comprise the wave) and construction (each leg of a triangle will subdivide into its own price pattern if the chart shows sufficient detail). Wave-D can be longer than Wave B - this is known as reverse alternation (this is not permissible in orthodox Elliott Wave).
TIME
Although Wave-B is usually longer than Wave-A in duration, there are instances where it can be shorter.
When two adjacent waves of a triangle are similar in time, the next wave will likely be the sum of the combined times of the two adjacent waves. If the two adjacent waves are very different in duration, the duration of the next wave will likely be the average of the two adjacent waves.
POST PATTERN BEHAVIOUR
The thrust after a NEoWave Contracting Triangle will generally be as large as the widest wave of the Triangle. Confirmation of a new trend requires the initial rally to be larger and faster than the longest countertrend rally of the price pattern, either wave-B or -D.
Lexicon
Corrective price pattern: A reaction against the prevailing trend of one larger degree. Overlapping is a common feature although it is not a strict prerequisite. Corrections are an outgrowth of indecision or ambiguity with respect to the future. They are labelled alphabetically (A-B-C etc).
Elliott Wave Principle: the idea that market behaviour is self-affine in nature due to recurrent oscillations in public opinion across different but simultaneous timeframes. It posits that price action can be defined, quantified and classified, and used to project the future evolution of price.
Impulsive price pattern: A fast-moving market. Impulse waves produce a significant change in the price level. A distinctive feature is minimal or no overlapping, depicting a strong level of conviction about the outlook. They contain five segments labelled numerically (waves 1-2-3-4-5).
NEoWave: Neely Extensions of Elliott Wave. The body of knowledge enunciated by Glenn Neely, represents a significant break or extension of the original theory postulated by Ralph Elliott.
Price behaviour: the quantitative assessment of price action. Essentially, the largest, fastest moves are always in the direction of the prevailing psychological trend.
Wave structure: the quantitative relationship between different waves of price action.
Transmission time:
Sydney: 27-December-2024 16:57
Ljubljana: 27-December-2024 06:57
London: 27-December-2024 05:57
New York: 27-December-2024 01:57
A high-low chart plots the period's highs and lows in the order in which they occur. I only utilise price action between 10:10 and 16:00 when the market is fully open.
Wave-D can be longer than Wave B - this is known as Reverse Alternation in NEoWave - this is not permissible in orthodox Elliott Wave.
Time is usually measured using the lows and highs rather than the actual beginning or ending of the pattern. This means that nearby lows and highs are used even if they do not belong to the price pattern. If the wave to be forecast commences well after the low or high, applying time from the beginning will likely yield a better forecast.