


ASX 200 Forecast 2025-Jan-17
Sideways to lower

Disclaimer: This market letter represents the views and opinions of the author. It does not constitute investment advice. It is my online journal to share knowledge of an alternative philosophy of financial markets and how I use this philosophy to trade. You should consult a financial adviser if you require professional assistance with your portfolio. I am not a financial adviser.
A link to an article I wrote for FNArena, “As good as it gets for Australian Equities.”
Summary
The countertrend rally has probably peaked.
Regarding the outlook for the next 2–3 years, a bear market has likely commenced. From peak to trough, the decline will likely be around 24%.
Sometime in 2027 or 2028, a new secular bull market will commence, defined here as a significant multi-decade advance. Wave Structure suggests it will be the greatest bull market in the history of Australian equities.
In the wake
Australia's benchmark share market index, the S&P/ASX 200 (ASX 200), closed at 8310.4 points, gaining 16.3 points or 0.2% for the week.
Exhibit 1 illustrates the price movement for the ASX 200 during the past week.

Last week, I wrote:
[B] may have already peaked and even completed at the slightly lower high of 8356.2 points today. Or there may be one more rally attempt next week. I think the odds slightly favour the latter proposition, which is what I am waiting for to pull the trigger on a new short ASX 200 position.
The absence of significant upside throughout the week reinforces the likelihood that the current interpretation of Wave Structure is correct.
Forecast
Exhibit 2 depicts the prevailing interpretation of price behaviour on the weekly high-low chart for the ASX 200.1
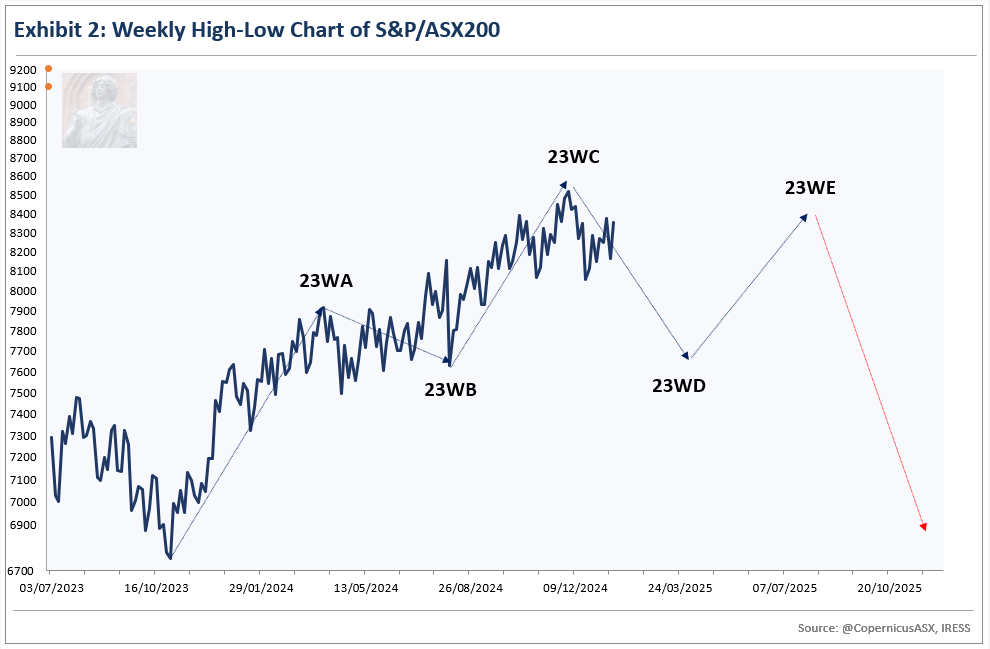
The forecast is unrevised from last week.
The best explanation of price behaviour from late 2023 is a NEoWave Contracting Triangle, a corrective price pattern consisting of five segments or waves labelled alphabetically (A-B-C-D-E). Appendix One provides a deep dive into this price pattern.
The downtrend is keeping pace with the price/time progression line, which reinforces the likelihood that the interpretation of Wave Structure is correct. Usually, there is a reasonable break above this line halfway through the projected move.
23WD will likely bottom somewhere between 7500 and 7700 points in late 1Q2025 or early 2Q2025.2
23WD should alternate with 23WB in as many ways as possible. Alternation can occur via the following: price, time, the severity of retracement of the prior wave, complexity3 and construction4.
A cursory glance reveals that 23WB was a shallow correction that moved sideways. As a result, 23WD is expected to unfold in a downward direction, likely retracing a significant portion of the previous wave, 23WC. It is possible that 23WD may temporarily drop below the start of 23WC, which is at 7628.1 points. The forecast price range for the low of 23WD is set between 7500 to 7700 points.
Regarding time, since 23WB and 23WC are very different in duration, 23WD is likely to be the average of these two waves, which suggests a duration of circa 18-19 weeks.5 This points to the end of March or early April as the ideal time conclusion for 23WD.
Exhibit 3 depicts the interpretation of price behaviour on the daily high-low chart for the ASX 200.
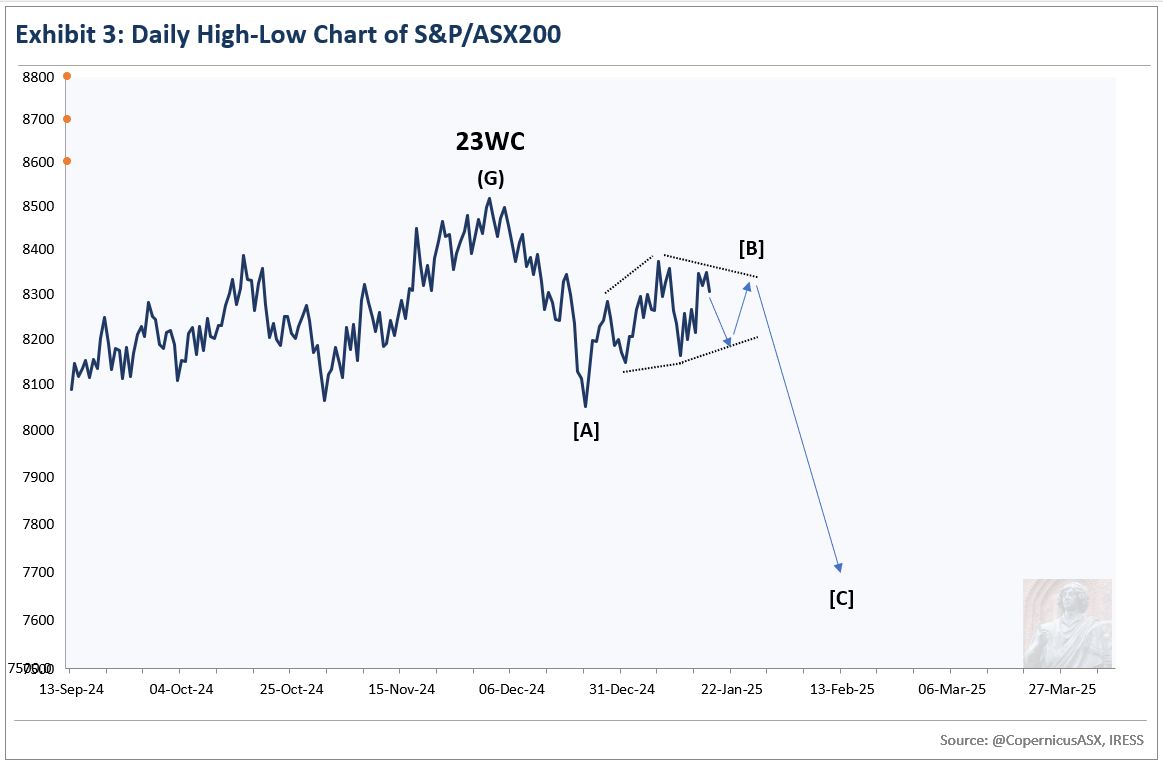
The forecast has been revised.
My best guess is that 23WD is unfolding as a NEoWave Neutral Triangle, (A-B-C-D-E) on the daily high-low chart.
The NEoWave Neutral Triangle is a corrective price pattern consisting of five segments or waves: three trending waves labelled A, C, and E and two countertrend waves labelled B and D. Wave C is the longest of the trending waves.
Last week, I wrote:
[B] may have already peaked and even completed at the slightly lower high of 8356.2 points today. Or there may be one more rally attempt next week. I think the odds slightly favour the latter proposition, which is what I am waiting for to pull the trigger on a new short ASX 200 position.
The sharp selloff on Monday suggested that [C] had already commenced, but the subsequent recovery strongly suggests that [B] is still ongoing.
I suspect that [B] is forming a NEoWave Diametric - which is why I went short yesterday - and I have drawn a tentative forecast. The high of this price pattern has probably already occurred.
The forecast calls for a rangebound market for the next two weeks before the next trending leg to the downside.
Smart money
Exhibit 4 compares the ASX 200 with the Last Hour Index, a gauge of what participants with deep pockets (smart money) are doing.

The premise behind this indicator is that professionals are most active during the final hour of trading, a time when liquidity reaches its zenith. This interval also marks the final chance to initiate or liquidate positions within regular trading hours. Therefore, the Last Hour Index offers an alternative view of risk appetite with turning points in this indicator typically preceding turning points in the benchmark index.
The Last Hour Index has been moving higher recently, which is not what I expected. If this Index is leading the market by several weeks, that points to the likelihood of more upside in the near term. If the Index is leading the market by several months, then another down leg is probable.
Market Internals
Exhibit 5 compares the ASX 200 with the Composite Advance-Decline Line (A-D Line).
The A-D Line is a representation of the cumulative total of the number of advancing issues (stocks that closed higher) minus the number of declining issues (stocks that closed lower) each day. When most stocks are moving higher, the A-D Line rises. Conversely, a declining A-D Line indicates that most stocks are moving lower. It provides a strong indication of the health of a market trend. The greater the participation of stocks, the greater the chance the trend will continue in the foreseeable future.

The chart above does not include data for today.
The market (the universe of stocks) is locked in a downtrend despite the reasonable bounce/rally in the ASX 200. This indicator suggests that the ASX 200’s risk-reward profile is skewed to the downside.
Risk Management
The target range over the next few months is 7500-7700 points. The likely ceiling on the upside is about 8400 points. With the ASX 200 closing at 8310.4 points, the risk-reward profile is heavily skewed to the downside in this timeframe.
Investment accounts
On December 3, I finished the sale of all non-core holdings, retaining some quality and speculative stocks for the medium to long term.
On January 16, I hedged the remainder of the portfolio against downside risk.
Trading Accounts
On January 16, I opened a levered short ASX 200 position with the cash index around 8330 points.
Appendix One

The NEoWave Contracting Triangle is a corrective price pattern consisting of five segments or waves: three trending waves labelled A, C, and E, and two countertrend waves, B and D.
Each successive trending wave is smaller than the preceding one, hence the designation "contracting".
PRICE
Wave-A is a significant violent move. It is usually the longest leg of the triangle.
Wave-B should retrace at least 33-38.2% of wave-A. It usually retraces around 80%. In some instances, wave-B can be the longest wave of the triangle.
The ideal price conclusion of wave-C is 61.8% of wave-A. In some instances, when this wave reaches the highest point of the price pattern, it will extend past the ideal price conclusion by a margin.
Wave-D should retrace at least 33-38.2% of Wave-C. It usually retraces 61.8% or more. It should alternate with wave-B in as many ways as possible. Alternation can occur via the following: price, time, the severity of retracement of the prior wave, complexity (essentially how many up and down moves comprise the wave) and construction (each leg of a triangle will subdivide into its own price pattern if the chart shows sufficient detail). Wave-D can be longer than Wave B - this is known as reverse alternation (this is not permissible in orthodox Elliott Wave).
TIME
Although Wave-B is usually longer than Wave-A in duration, there are instances where it can be shorter.
When two adjacent waves of a triangle are similar in time, the next wave will likely be the sum of the combined times of the two adjacent waves. If the two adjacent waves are very different in duration, the duration of the next wave will likely be the average of the two adjacent waves.
POST PATTERN BEHAVIOUR
The thrust after a NEoWave Contracting Triangle will generally be as large as the widest wave of the Triangle. Confirmation of a new trend requires the initial rally to be larger and faster than the longest countertrend rally of the price pattern, either wave-B or -D.
Lexicon
Corrective price pattern: A reaction against the prevailing trend of one larger degree. Overlapping is a common feature although it is not a strict prerequisite. Corrections are an outgrowth of indecision or ambiguity with respect to the future. They are labelled alphabetically (A-B-C etc).
Elliott Wave Principle: the idea that market behaviour is self-affine in nature due to recurrent oscillations in public opinion across different but simultaneous timeframes. It posits that price action can be defined, quantified and classified, and used to project the future evolution of price.
Impulsive price pattern: A fast-moving market. Impulse waves produce a significant change in the price level. A distinctive feature is minimal or no overlapping, depicting a strong level of conviction about the outlook. They contain five segments labelled numerically (waves 1-2-3-4-5).
NEoWave: Neely Extensions of Elliott Wave. The body of knowledge enunciated by Glenn Neely, represents a significant break or extension of the original theory postulated by Ralph Elliott.
Price behaviour: the quantitative assessment of price action. Essentially, the largest, fastest moves are always in the direction of the prevailing psychological trend.
Wave structure: the quantitative relationship between different waves of price action.
Transmission time:
Sydney: 17-January-2025 16:40
Ljubljana: 17-January-2025 06:40
London: 17-January-2025 05:40
New York: 17-January-2025 01:40
A high-low chart plots the period's highs and lows in the order in which they occur. I only utilise price action between 10:10 and 16:00 when the market is fully open.
23WD is the nomenclature for Wave D of the corrective price pattern that commenced in 2023. This means of labelling was developed by the late Zoran Gayer.
Complexity refers to the number of up and down movements that make up a wave.
A sufficiently detailed chart allows one to view each wave or segment of a price pattern as a distinct price pattern.
Time is usually measured using the lows and highs rather than the actual beginning or ending of the pattern. This means that nearby lows and highs are used even if they do not belong to the price pattern. If the wave to be forecast commences well after the low or high, applying time from the beginning will likely yield a better forecast.