


ASX 200 Forecast 2025-May-18
Downside risks building

Disclaimer: This market letter represents the views and opinions of the author. It does not constitute investment advice. It is my online journal to share knowledge of an alternative philosophy of financial markets and how I use this philosophy to trade. You should consult a financial adviser if you require professional assistance with your portfolio. I am not a financial adviser.
Summary
It remains likely that the ASX 200 will approach and probably breach the recent low of 7169 points.
A bear market has commenced. The decline will likely be around 24% or slightly longer from peak to trough. The approximate target is circa 6550 points. While the price pattern will likely be at least 2.5 years, the actual trough will occur in the next few months.
A new secular bull market will commence sometime in 2H 2027 (from a higher low). A secular bull market is a significant multi-decade advance. Wave Structure suggests it will be the greatest bull market in the history of Australian equities.
In the wake
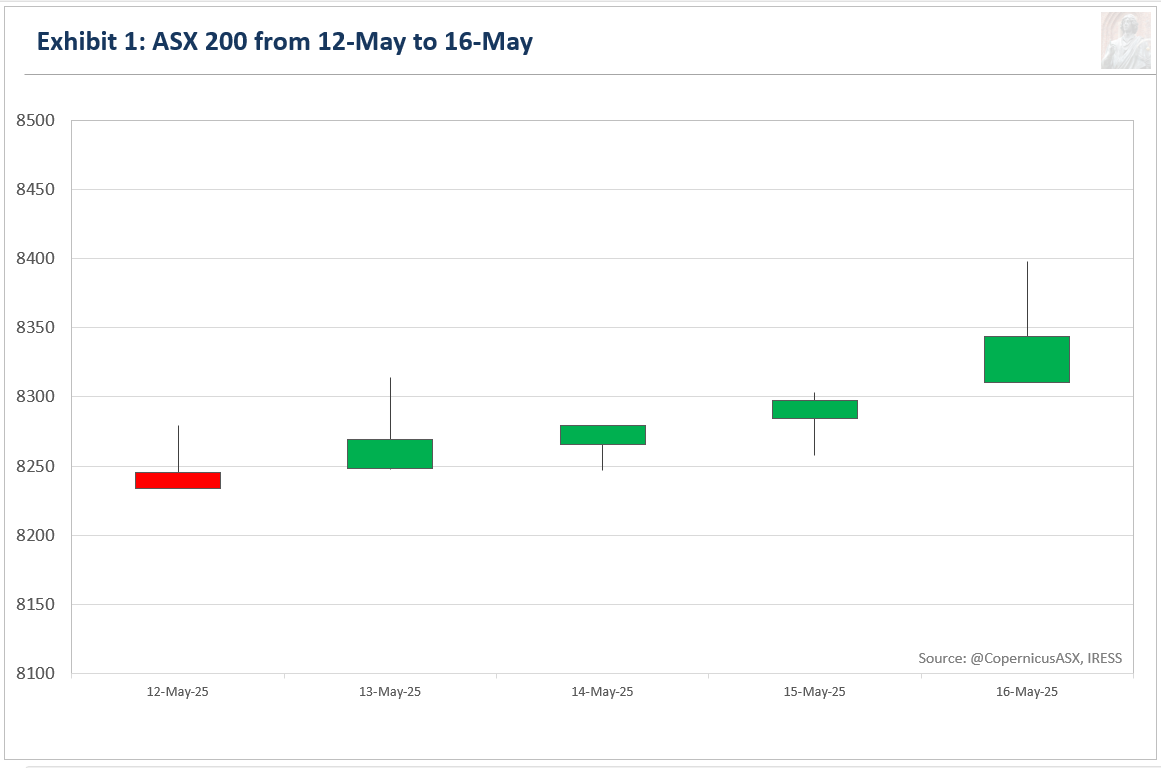
Australia's benchmark share market index, the S&P/ASX 200 (ASX 200), closed at 8343.69 points, gaining 112.48 points or 1.3% for the week.
Exhibit 1 illustrates the price movement for the ASX 200 during the past week.
Last week, I wrote:
The price action over the next two to four weeks will go a long way towards reinforcing the above thesis.
The ongoing rally makes my previous interpretation increasingly unlikely.
Forecast
Exhibit 2 depicts a new interpretation of Wave Structure on the daily high-low chart for the ASX 200.1

The ongoing rally makes the idea of a NEoWave Diametric increasingly unlikely.
The only other price pattern that makes sense at this juncture is a NEoWave Flat (A-B-C). A Flat is a corrective price pattern composed of three segments or waves. Appendix One provides a deep dive into this price pattern.
While I don't have a strong level of conviction in this interpretation (as I did with the Diametric), it certainly explains the laboured, but persistent nature of the current rally. Furthermore, when the situation is uncertain, it's wise to assume that you are in the midst of a price pattern, and a Flat certainly fits that description.
In a Flat correction, Wave A is typically quite volatile. Wave B must retrace at least 61.8% of Wave A. Most of the time, it will retrace between 61.8% and 99% of Wave A. In some cases, it can retrace up to 130% of Wave A, and in rare instances, even up to 160% of Wave A. Wave C is usually slightly longer than Wave A.
Wave B must be longer in duration than Wave A, and is typically three to five times the duration of Wave A.
What I am labelling as [b] is shorter in duration and simpler than [a], which suggests at least one meaningful pullback is likely, probably in the coming days to weeks. The forecast above assumes [b] will be about 3 times the duration of [a], but there is no real way of determining this - B waves are the hardest to predict.
Despite the new interpretation, the target range of 6,550 to 7,000 points remains the same. However, the timing of the actual low is likely to be postponed by several months.
Over the next 3 to 9 months, the risk-reward profile is heavily skewed to the downside.
I have received several questions regarding the potential of a secular bull market (20–30-year bull market targeting 120,000 plus) that I anticipate will begin later this decade, having already started.
From a NEoWave or psychological viewpoint, it is impossible. The recent decline is too brief in duration, too simplistic, and too limited in price.
25WA is the first wave of a larger price pattern, which I believe will be the last downward phase of a multi-decade correction. This larger price pattern must therefore be larger in price, and/or longer in duration and/or more complicated than the final rally into the all-time high. It must qualify on at least two of these measures to be a bigger degree pattern.
The last rally began around 6794 points (or lower) and lasted at least 15.5 months. Therefore, the ASX 200 must break 6794 at a minimum and/or move sideways in a very choppy manner for at least 15.5 months before we can even consider the beginning of a secular bull market from a psychological perspective. By the end of this price pattern, bearish sentiment must be widespread. I also expect to see one or more news covers similar to Business Week's infamous “Death of Equities” from August 13, 1979.
Smart money
Exhibit 3 compares the ASX 200 with the Last Hour Index using the Equal-Weight ASX 200 for its calculations.2
The premise behind this indicator is that professionals with deep pockets are most active during the final hour of trading when liquidity reaches its zenith. This interval also marks the final chance to initiate or liquidate positions within regular trading hours. Therefore, the Last Hour Index offers an alternative view of risk appetite, with turning points in this indicator typically preceding turning points in the benchmark index.

This week, deep pockets (typically smart money) largely remained on the sidelines.
They certainly do not believe in the veracity of the current rally, but neither are they outright bearish either.
Market Internals
Exhibit 4 compares the ASX 200 with the Composite Advance-Decline Line (A-D Line).
The A-D Line is a representation of the cumulative total of the number of advancing issues (stocks that closed higher) minus the number of declining issues (stocks that closed lower) each day. When most stocks are moving higher, the A-D Line rises. Conversely, a declining A-D Line indicates that most stocks are moving lower. It provides a strong indication of the health of a market trend. The greater the participation of stocks, the greater the chance the trend will continue in the foreseeable future.
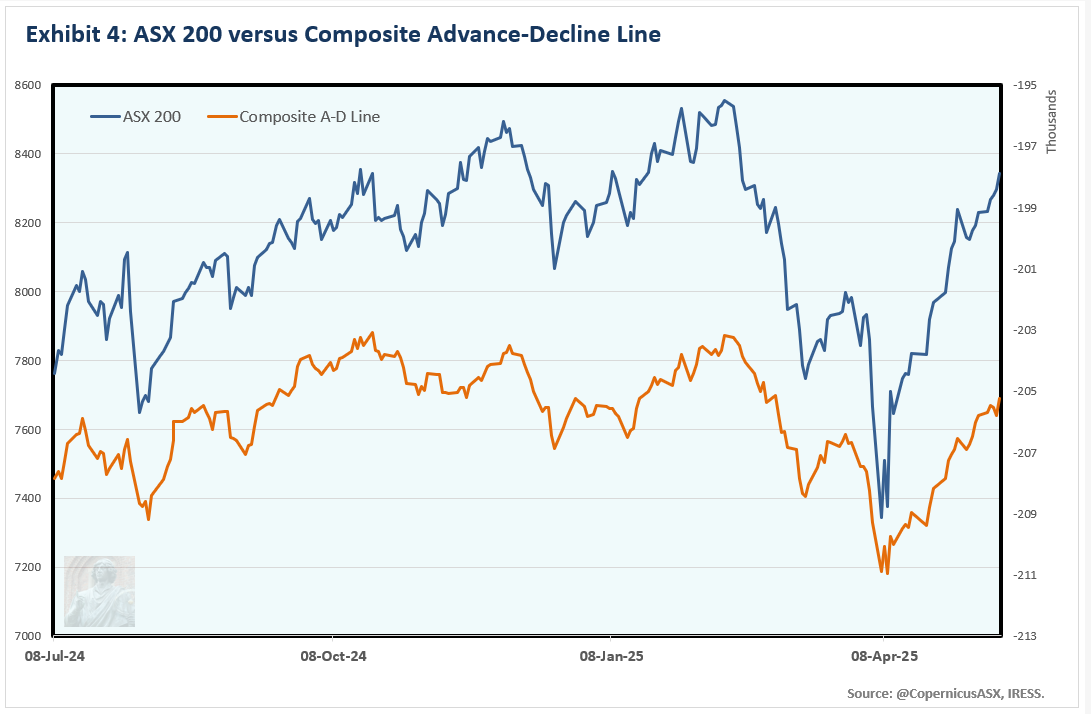
While the AD Line continues to behave in a satisfactory manner to the upside, bearish divergences exist between the ASX 200 and shorter-term breadth measures (not shown), which suggest that this rally is quite mature.
Risk Management
Investment Accounts
Hedged against downside risk using the Betashares Australian Equities Strong Bear Complex ETF (BBOZ).
10/04/2025. Bought 10,000 BBOZ at $28.34. Last traded price $24.59.
Trading Accounts
I remain short the ASX 200. Loss.
I will reassess positions on the first reasonable pullback.
Appendix One

The NEoWave Flat is a corrective price pattern composed of three segments or waves: two trending or directional waves labelled A and C, and one countertrend or nondirectional wave, B.
Price
Wave A is usually violent relative to the surrounding price action.
Wave B must retrace at least 61.8% of wave A. In a normal Flat, the retracement will be between 61% to 99%. In an Expanded Flat, wave B will retrace between 101% to 130%. In rare instances, it could retrace up to 161% of A.
Wave C will usually be slightly longer than Wave A. It will usually make a lower low unless Wave B is 125% or greater than Wave A.
Time and Complexity
Wave B will likely be 3-5 times longer in duration than Wave A.
If Wave A and Wave B are distinctly different in duration, Wave C should take half of the time of A + B, plus half of the complexity of A + B. If Wave A and Wave B are similar in duration, Wave C will likely be the sum of these two waves.
Lexicon
Corrective price pattern: A reaction against the prevailing trend of one larger degree. Overlapping is a common feature although it is not a strict prerequisite. Corrections are an outgrowth of indecision or ambiguity with respect to the future. They are labelled alphabetically (A-B-C etc).
Elliott Wave Principle: the idea that market behaviour is self-affine in nature due to recurrent oscillations in public opinion across different but simultaneous timeframes. It posits that price action can be defined, quantified and classified, and used to project the future evolution of price.
Impulsive price pattern: A fast-moving market. Impulse waves produce a significant change in the price level. A distinctive feature is minimal or no overlapping, depicting a strong level of conviction about the outlook. They contain five segments labelled numerically (waves 1-2-3-4-5).
NEoWave: Neely Extensions of Elliott Wave. The body of knowledge enunciated by Glenn Neely, represents a significant break or extension of the original theory postulated by Ralph Elliott.
Price behaviour: the qualitative assessment of price action. Essentially, the largest, fastest moves are always in the direction of the prevailing psychological trend.
Wave structure: the quantitative relationship between different waves of price action.
Transmission time:
Sydney: 18-May-2025 01:03
Ljubljana: 17-May-2025 17:03
London: 17-May-2025 16:03
New York: 17-May-2025 11:03
A high-low chart plots the period's highs and lows in the order in which they occur. I only utilise price action between 10:10 and 16:00 when the market is fully open.
The ASX 200 Equal Weight Index includes the same constituents as the benchmark ASX 200 Index. The latter is a capitalisation-weighted index, while the former gives each company an equal weighting. The Official Close is included in the calculation.