


ASX 200 Forecast 2024-Jun-22
Looming bottom

Summary
Next week
Looming bottom. The ASX 200 is likely to decline to between 7602 to 7698 points this week before a bounce/rally ensues.
Next 4-9 months
Significant rally. The ASX 200 will likely peak between 8369 and 8835 points later this year or early next year.
2027-2028
A new secular bull market, defined here as a significant multi-decade advance, will commence sometime in 2027 or 2028. Long-term wave structure and price behaviour suggest it will be the greatest bull market in the history of Australian equities.
Disclaimer: at end.
In the wake
Australia's benchmark share market index, the S&P/ASX 200 (ASX 200), closed at 7861.7 points, gaining 95.7 points or 1.2% for the week.
Exhibit 1 illustrates the price movement for the ASX 200 during the past week.

Last week, I wrote:
In the most likely scenario, the ASX 200 dips towards 7628 points early this coming week before bouncing/rallying around 150 points or more. One last small decline will then take place to complete the pattern at a higher low. In the second most likely scenario, the price low of G is in. The ASX 200 bounces another circa 130 points before one last small decline completes the pattern at a higher low.
The ASX 200 hovered between the two different scenarios. As the market did not do anything completely unexpected, the current interpretation remains valid, with only a minor revision to the price forecast.
Forecast
Exhibit 2 reveals the revised interpretation of price behaviour on the daily high-low chart for the ASX 200.1

The price action since March 8th is consistent with a NEoWave Diametric, which is a Corrective Price Pattern composed of seven waves, labelled A through G. Further details about this price pattern are available in Exhibit 3 below.
In a Diametric, wave-G is likely to resemble wave-A in price and time or be related by 61.8%.
G cannot be 100% of the price of A because it would marginally break the low of E at 7601.5 points, which is not permissible in a Diametric displaying contraction in waves-E through wave-G. If G is, therefore, to resemble A, it will likely bottom somewhere just north of 7602 points.
Alternatively, if G is 61.8% of A, this generates an approximate target of 7699.9 points. While the low on Monday was 7698.2 points, G does not look finished, so we have to assume it is likely that the ASX 200 will undercut 7698.2 points sometime this week, even if by just a tick (0.1 points).
In terms of forecasting the bottom or completion date of G, it will likely be around 11 or 12 trading days, which suggests this coming Tuesday or Wednesday. This will make it similar to B (11 trading days), C (13.5 trading days), D (11 trading days measured from start to high), and E (10 trading days).2
Based on this, it is expected that G will hit its lowest mark, estimated to be between 7602 and 7698 points, around the midsection of the forthcoming week.
Now, it is possible that even though G bottoms this coming week, it will not be completed for another 1-3 weeks. Recall my words from last week:
When the future trend is powerful, it acts on the present so that the unfolding price pattern does not terminate at the low but rather at a later, higher low. The latter and higher the price pattern finishes, the more powerful the future uptrend.
In this scenario, G will complete at a higher low in another 1-3 weeks
So, we are potentially within a few days, and no more than a few weeks, of the sideways correction, labelled [X], finishing, and a new significant multi-month rally commencing. Regardless of whether G completes at its low or at a higher low, downside risk should be virtually non-existent after this Thursday/Friday.

The NEoWave Diametric is a Corrective Price Pattern comprising seven waves. It includes four trending waves (A, C, E, & G) and three countertrend waves (B, D, & F).
There are two key characteristics of Diametrics: First, they display expansion during the first four waves followed by contraction, or vice versa. Second, five of the seven waves tend to be similar in duration.
Exhibit 4 reveals the weekly high-low chart for the ASX 200.

Upon the completion of [X], a major rally labelled [Y] will follow.
In terms of price, [Y] will likely be related to [W] either internally or externally. If they are externally related, the target is 8629 points, derived by taking 61.8% of [W] and adding it to the top of [W]. If they are internally related, the tentative targets are circa 8369 and 8835 points, derived by taking 61.8% and 100% of [W], and adding it to the expected conclusion of [X] at around 7640 points. These calculations are depicted above.
In terms of time, [Y] will likely relate to [W] by around 61.8%, 100%, 161.8% or 200% in time. These calculations are depicted above.
Once [W] commences, the rate of ascent will guide us to which price target/s and time target/s are the most plausible for [Y]. It will likely peak and complete in the shaded dark green region above.
Around the traps
Exhibit 5 compares the Banking and Materials sectors since the start of 2024.
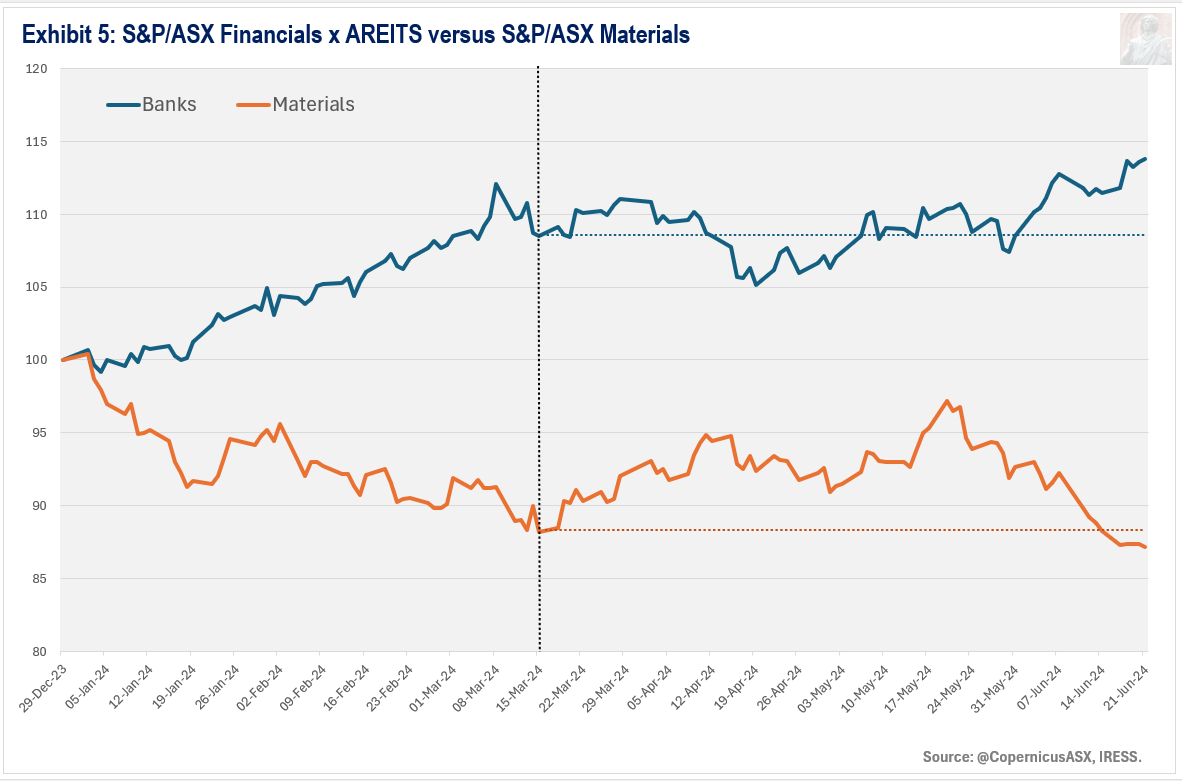
On 15 March, I wrote that I expect:
A large rotation out of banks and into mining companies.
Over the past few weeks, Banks have caught a bid while the Materials sector has become friendless.
The new all-time high in the Banks bodes well for the ASX 200, as Banks usually display relative strength early in the cycle. I have 5 to 10% of upside pencilled in for the Banks from current levels.
While the Banks have moved ahead of mining and related companies in the past few weeks, I believe the Materials sector will be the clear winner through the remainder of 2024. I have 10 to 30% of upside pencilled in for the Materials from current levels.
The top of the market cycle is marked by relative strength in the mining and energy sectors. The strong rally in mining and energy companies will likely coincide with rising interest rates. A cursory glance at the chart of the Aussie 10-year bond suggests the yield could be 1-2% higher than where it currently sits in the next 6-12 months. Please note that this is not a forecast. However, from a philosophical viewpoint, it makes for an excellent catalyst to usher in a meaningful top for the ASX 200 later this year or early next year.
Portfolio Management
While Wave Structure points to the likelihood of much higher prices for the ASX 200 for the remainder of 2024, this rally will likely be concentrated in fewer and fewer stocks as it progresses. It still makes sense to remain fully invested, but only in companies performing well from a price viewpoint.
Disclaimer
This market letter was prepared by Daniel Goulding and represents the views and opinions of the author. It does not constitute investment advice. My work is didactic in nature, serving to increase readers’ awareness of an alternative philosophy of financial markets. I write generally and cannot determine whether an investment is appropriate for your particular needs, individual circumstances or risk profile. You should consult a financial adviser if you require professional assistance with your portfolio. I am not licenced or affiliated with any licensee. Therefore, I am free to speak my mind.
Lexicon
Composite Advance-Decline Line (A-D Line): the cumulative total of the number of advancing issues (stocks that closed higher) less the number of declining issues (stocks that closed lower) each day. The A-D Line is the classic measure of market breadth – a term that describes how many stocks are participating in a market trend. When the majority of stocks are moving higher, this is reflected in a rising A-D Line. A declining A-D Line, on the other hand, indicates that the majority of stocks are moving lower.
Corrective price pattern: A reaction against the prevailing trend of one larger degree. Overlapping is a common feature although it is not a strict prerequisite. Corrections are an outgrowth of indecision or ambiguity with respect to the future. They are labelled alphabetically (A-B-C etc).
Elliott Wave Principle: the idea that market behaviour is self-affine in nature due to recurrent oscillations in public opinion across different but simultaneous timeframes. It posits that price action can be defined, quantified and classified, and used to project the future evolution of price.
Impulsive price pattern: A fast-moving market. Impulse waves produce a significant change in the price level. A distinctive feature is minimal or no overlapping, depicting a strong level of conviction about the outlook. They contain five segments labelled numerically (waves 1-2-3-4-5).
Last Hour Index: the cumulative measure of the net change in a share market index during the last hour of trade. The idea behind this indicator is that large market participants are most active in the last hour of trading when liquidity is at its zenith, as well as being the final opportunity for them to open or close positions ahead of the close of trade.
NEoWave: Neely Extensions of Elliott Wave. The body of knowledge enunciated by Glenn Neely, represents a significant break or extension of the original theory postulated by Ralph Elliott.
Price behaviour: the quantitative assessment of price action. Essentially, the largest, fastest moves are always in the direction of the prevailing psychological trend.
Wave structure: the quantitative relationship between different waves of price action.
Transmission time:
Sydney: 15-June-2024 15:09
Ljubljana: 15-June-2024 07:09
London: 15-June-2024 06:09
New York: 15-June-2024 01:09
A high-low chart plots the period's highs and lows in the order in which they occur.
Ordinarily, time is measured from high to low, but in some instances, it can be measured from start to high or start to end. Astute readers will note I shifted the conclusion of C to the right.