
ASX 200 Forecast 2024-May-03
ASX 200 Forecast 2024-May-03
Higher next week

Summary
Next week
Higher. The market will finish higher this coming week.
Next 8 months
Significant rally. The ASX 200 will easily eclipse 8000 points this year. The probable price range is 8233 to 8690 points in the next 8 months.
2026
A new secular bull market, defined here as a significant multi-decade advance, will commence around the year 2026. Long-term wave structure and price behaviour suggest it will be the greatest bull market in the history of Australian equities.
Disclaimer: at end.
In the wake
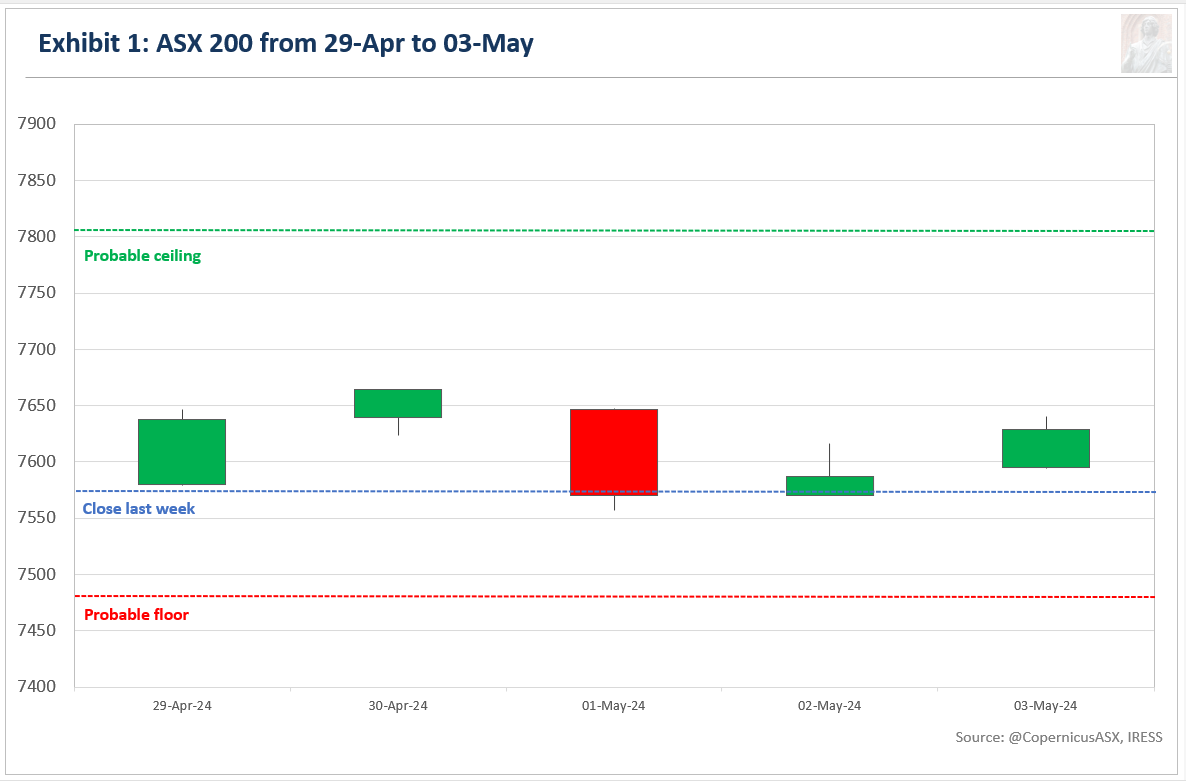
Australia's benchmark share market index, the S&P/ASX 200 (ASX 200), closed at 7629 points, gaining 53 points or 0.7% for the week.
Exhibit 1 illustrates the price movement for the ASX 200 during the past week.
Last week, I wrote:
The market should finish this coming week higher…
Next week, downside risk should be limited to 7480 points (1.3% below Friday’s close). The likely ceiling is 7809 points (3% above Friday’s close).
The ASX 200 closed higher, trading within the probable floor and ceiling. This reinforces the likelihood that the current interpretation of price action, or a similar variation, is correct.
Forecast
Exhibit 2 reveals the daily high-low chart for the ASX 200. A high-low chart plots the period's highs and lows in the order in which they occur.1
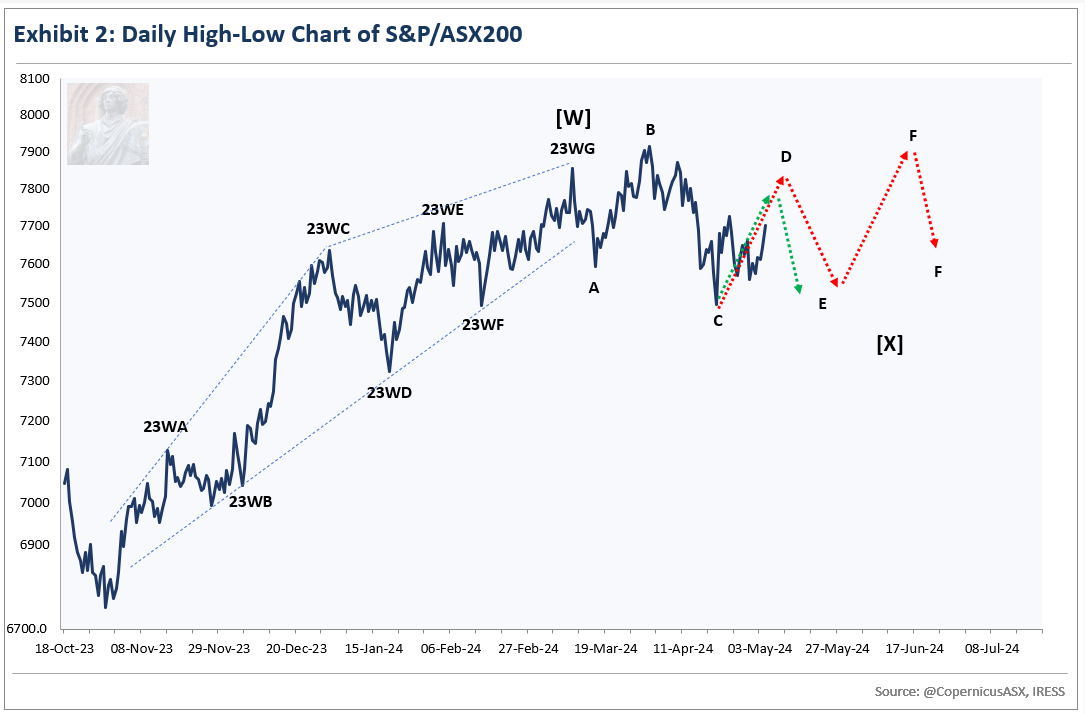
Last week, I wrote that I expected the ASX 200 to rally to around 7737 to 7809 points by around Wednesday or the following Wednesday.
It was obvious by the middle of the week that we should be working with the latter target, Wednesday, 8 May.
For the past six weeks, I have been assuming a NEoWave Neutral Triangle was the best explanation of price action since 8 March. This interpretation has served as a very good road map for how price has subsequently evolved.
While a NEoWave Neutral Triangle remains a plausible interpretation, we must now consider the likelihood that a NEoWave Diametric is a better explanation of price action.
Assuming D peaks sometime next week, it would be quite similar in time to both B and C. Three adjacent waves of similar duration in a Triangle is very unusual, almost impossible. That is not the case with a Diametric, where time similarity is one of its distinctive characteristics.
The good news is that, for the most part, both D and E will evolve similarly, regardless of whether a Diametric or Triangle is unfolding.
A Diametric would allow a slightly larger range for the peak of D. E would likely be twice as long in time, but probably similar in price.
The crucial difference between the two patterns is that a Diametric consists of 7 waves (A-B-C-D-E-F-G), whereas a Neutral Triangle has only 5 waves (A-B-C-D-E).
Exhibit 2 reveals both potential price trajectories. The Diametric is now my primary interpretation.
In framing the probable range for next week, I am taking both scenarios into account.
Next week, the risk-reward profile is skewed to the upside. I suspect the market will be around 60 points lower Monday morning before reversing and rallying for most of next week. The likely floor is 7541 points (88 points or 1.2% below Friday’s close). The likely ceiling is 7832 points (203 points or 2.7% above Friday’s close). If I had to pinpoint a specific peak for D, it would be 7772 points sometime Wednesday through Friday.
Exhibit 3 reveals the weekly high-low chart for the ASX 200.
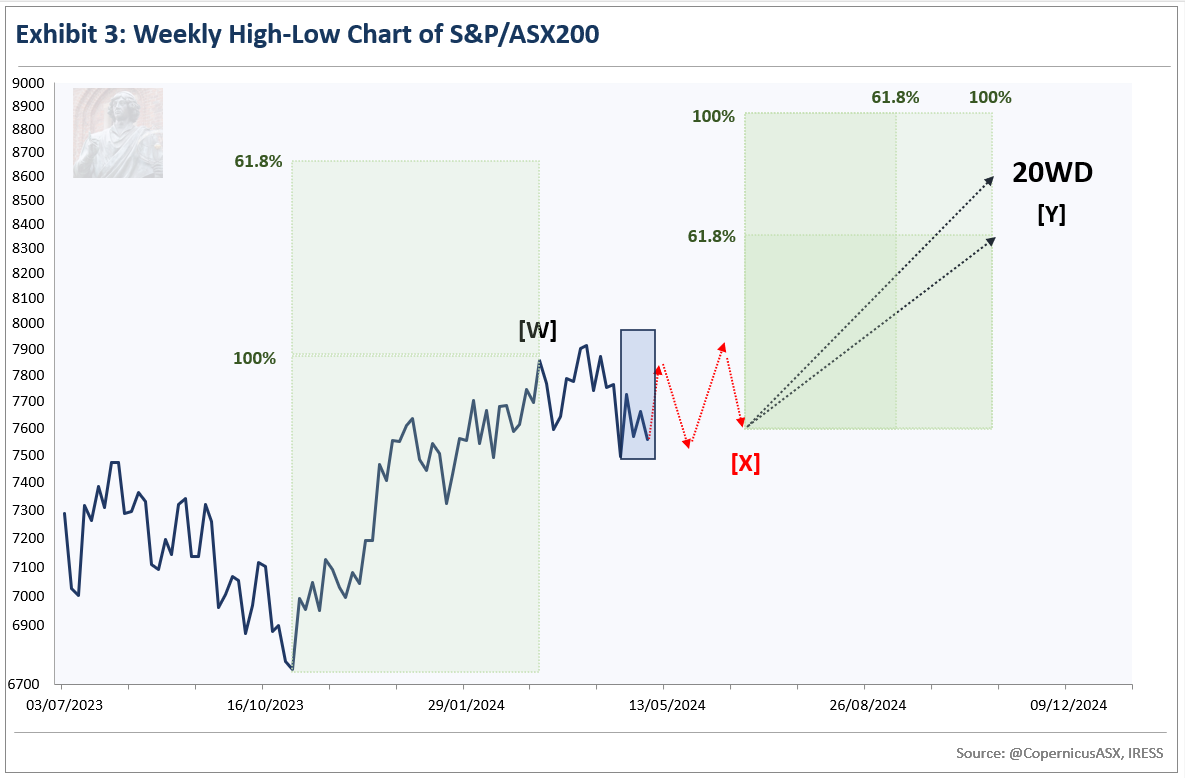
I have made minor revisions to this chart from last week, with [X] now unfolding as a NEoWave Neutral Triangle.
[X] will be followed by a major rally, which will be labelled [Y].
[Y] will likely be related to [W] either internally or externally.
If these two major rallies relate externally, the target is 8629 points, derived by taking 61.8% of [W] and adding it to the top of [W].
Alternatively, [Y] could relate to [W] internally by 61.8% or 100%. Specific levels can only be calculated once the conclusion of [X] has been confirmed.
For the time being, I will assume [Y] will relate to [W] by 100% in time, which suggests October for its conclusion. Other possible relations are 61.8% or 161.8% of the time of [W].
Exhibit 4 reveals the six-monthly high-low chart for the ASX 200.
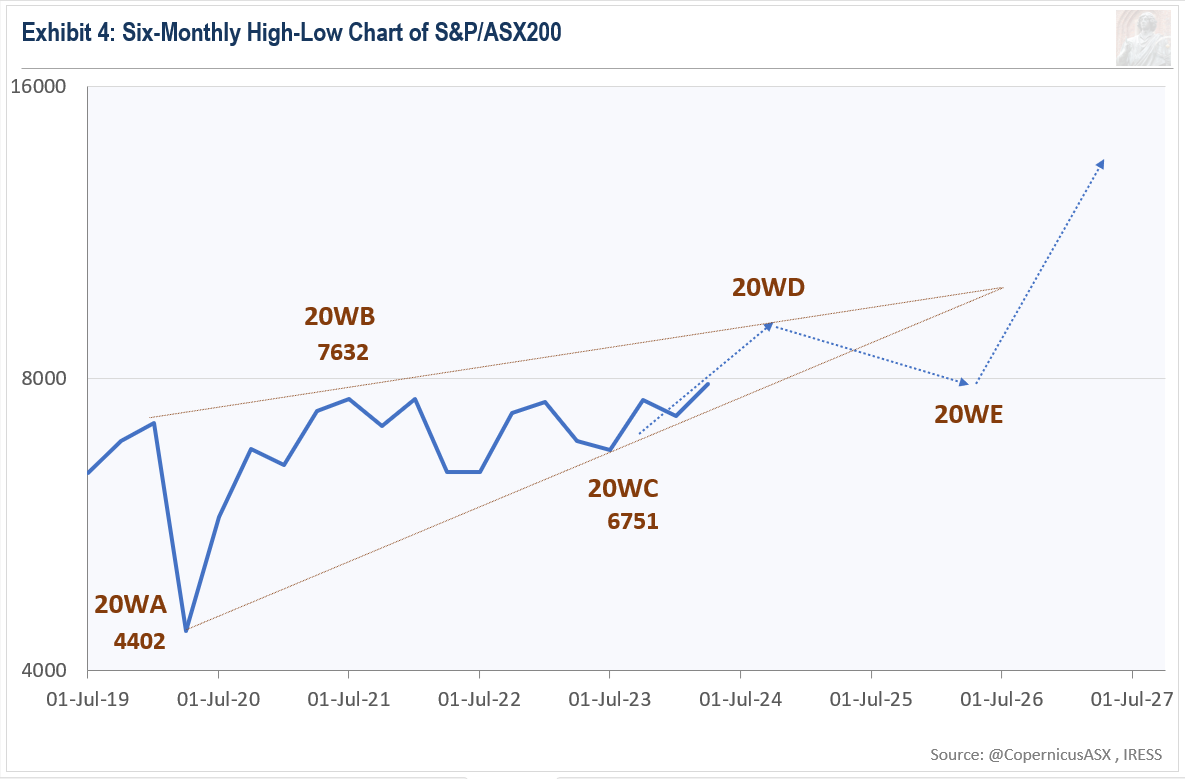
Wave Structure is consistent with a NEoWave Contracting Triangle (running variation) commencing in March 2020. Exhibit 5 below reveals more information about this price pattern.
There is sufficient evidence to confirm the likelihood that 20WD, Wave-D of the Corrective Price Pattern that commenced in 2020, is currently underway.
Per the six-monthly high-low chart, the minimum measured move for 20WD is likely 8200 points. It could go as high as 8500 to 8700 points. 20WD will likely finish in the second half of this year.
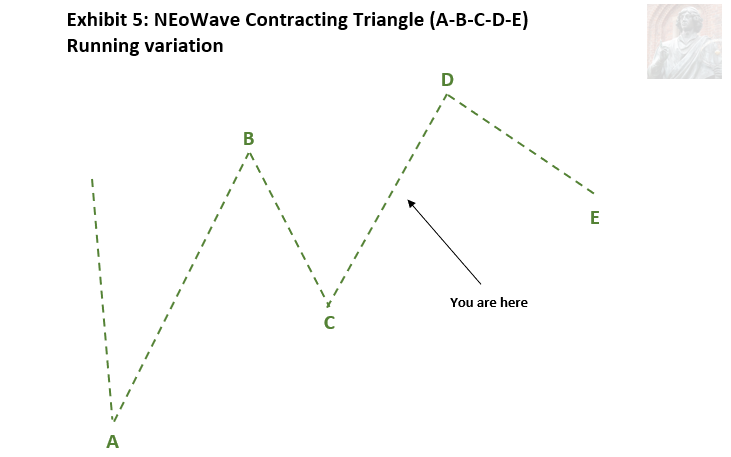
The NEoWave Contracting Triangle is a corrective price pattern that consists of five waves. It includes three trending waves (A, C, & E) and two countertrend waves (B & D). Each successive trending wave is smaller than the preceding trending wave, which is why it is called "contracting."
The “running” variation of a Contracting Triangle is rare. Both countertrend rallies are more substantial than the trending wave that they follow. Although they are larger in price, they move at a slower rate, which is why they are considered countertrend in nature. As a result, the correction happens "on the run". This pattern indicates a very strong (or weak if this price pattern occurs during a downtrend) market, and you can expect a significant move after the completion of the running Contracting Triangle.
Around the traps
Exhibit 6 compares the Banking and Materials2 sectors since the start of 2024.
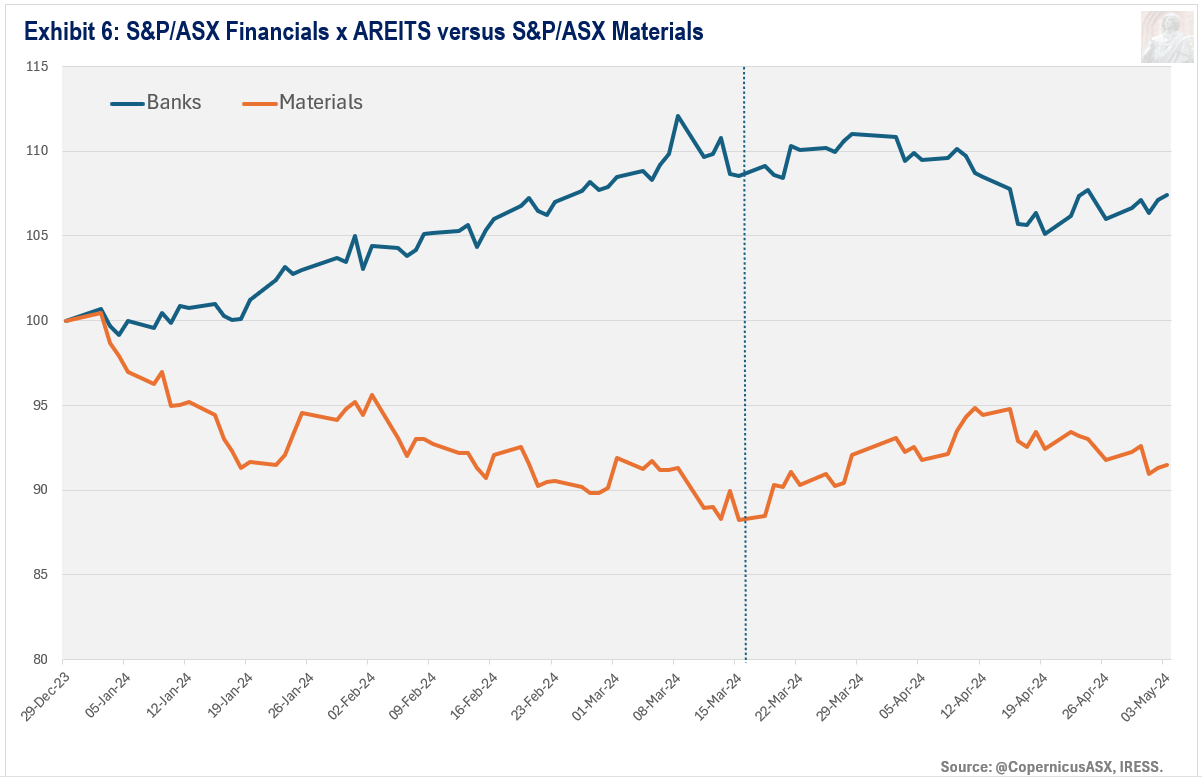
Rock > Paper.
On 15 March, I wrote that I expect:
A large rotation out of banks and into mining companies.
While the Materials (mining and related companies) sector has underperformed the S&P/ASX 200 Financials Ex A-REIT index (I refer to this index as the Banks since the four major banks comprise two-thirds of it) over the past one to two weeks, it continues to outperform since 15 March.
Smart money
Exhibit 7 compares the ASX 200 with the Last Hour Index, a gauge of what participants with deep pockets (smart money) are doing.
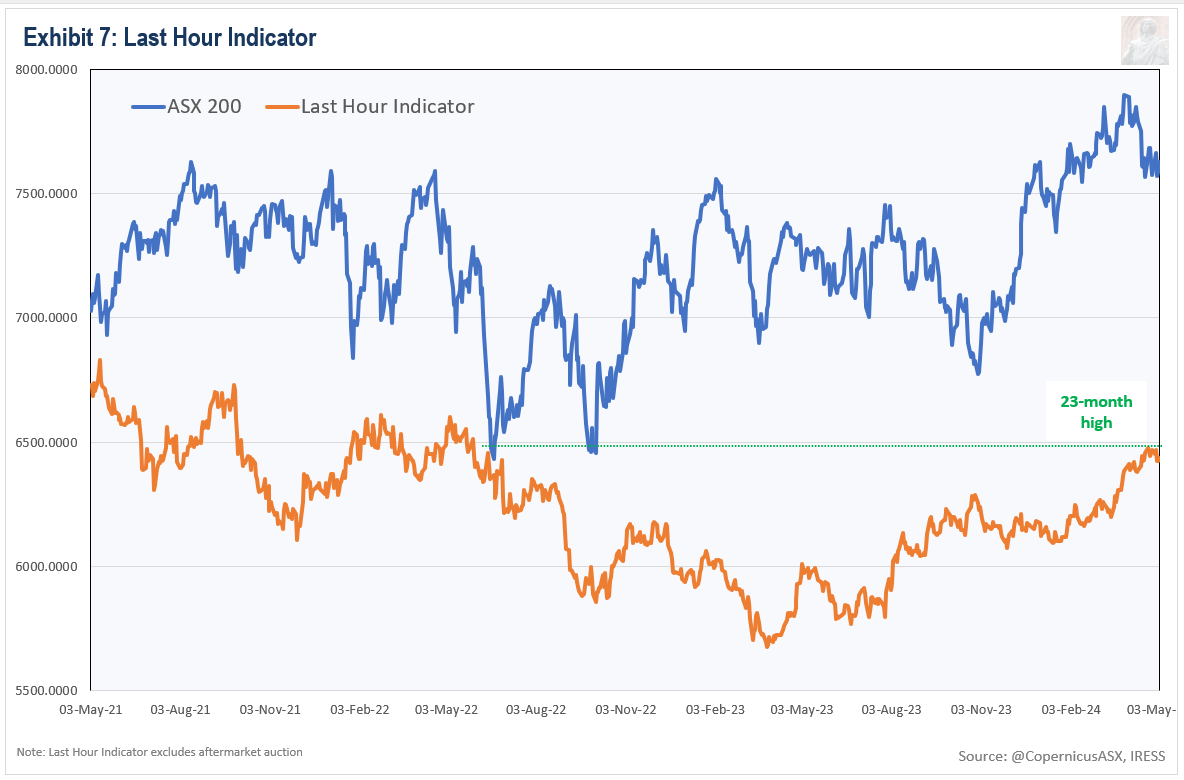
Despite a decline this past week, the recent 23-month high for the Last Hour Index is bullish, indicating the likelihood of additional upside for the ASX 200 over the short to medium term.
Portfolio Management
While Wave Structure points to the likelihood of much higher prices for the ASX 200 over the next 6 to 9 months, this rally will likely be concentrated in fewer and fewer stocks as it progresses. It still makes sense to remain fully invested, but only in companies performing well from a price viewpoint.
Disclaimer
This market letter was prepared by Daniel Goulding and represents the views and opinions of the author. It does not constitute investment advice. My work is didactic in nature, serving to increase readers’ awareness of an alternative philosophy of financial markets. I write generally and cannot determine whether an investment is appropriate for your particular needs, individual circumstances or risk profile. You should consult a financial adviser if you require professional assistance with your portfolio. I am not licenced or affiliated with any licensee. Therefore, I am free to speak my mind.
Lexicon
Composite Advance-Decline Line (A-D Line): the cumulative total of the number of advancing issues (stocks that closed higher) less the number of declining issues (stocks that closed lower) each day. The A-D Line is the classic measure of market breadth – a term that describes how many stocks are participating in a market trend. When the majority of stocks are moving higher, this is reflected in a rising A-D Line. A declining A-D Line, on the other hand, indicates that the majority of stocks are moving lower.
Corrective price pattern: A reaction against the prevailing trend of one larger degree. Overlapping is a common feature although it is not a strict prerequisite. Corrections are an outgrowth of indecision or ambiguity with respect to the future. They are labelled alphabetically (A-B-C etc).
Elliott Wave Principle: the idea that market behaviour is self-affine in nature due to recurrent oscillations in public opinion across different but simultaneous timeframes. It posits that price action can be defined, quantified and classified, and used to project the future evolution of price.
Impulsive price pattern: A fast-moving market. Impulse waves produce a significant change in the price level. A distinctive feature is minimal or no overlapping, depicting a strong level of conviction about the outlook. They contain five segments labelled numerically (waves 1-2-3-4-5).
Last Hour Index: the cumulative measure of the net change in a share market index during the last hour of trade. The idea behind this indicator is that large market participants are most active in the last hour of trading when liquidity is at its zenith, as well as being the final opportunity for them to open or close positions ahead of the close of trade.
NEoWave: Neely Extensions of Elliott Wave. The body of knowledge enunciated by Glenn Neely, represents a significant break or extension of the original theory postulated by Ralph Elliott.
Price behaviour: the quantitative assessment of price action. Essentially, the largest, fastest moves are always in the direction of the prevailing psychological trend.
Wave structure: the quantitative relationship between different waves of price action.
Transmission time:
Sydney: 03-May-2024 16:54
Ljubljana: 03-May-2024 08:54
London: 03-May-2024 07:54
New York: 03-May-2024 02:54
To ensure accurate analysis, I exclude the first ten minutes of trading and the Closing Single Price Auction which takes place between 4:10 pm and 4:11 pm. This is because I believe the behaviour of the ASX 200 during these times may not be a true reflection of mass psychology, which NEoWave attempts to quantify.