
ASX 200 Forecast 2024-May-25
ASX 200 Forecast 2024-May-25
Sideways to lower

Summary
Next week
Lower. The market should move sideways to lower over the coming week.
Next 8 months
Significant rally. The ASX 200 will easily eclipse 8000 points this year. The probable price range is 8233 to 8690 points in the next 8 months.
2026
A new secular bull market, defined here as a significant multi-decade advance, will commence around the year 2026. Long-term wave structure and price behaviour suggest it will be the greatest bull market in the history of Australian equities.
Disclaimer: at end.
In the wake
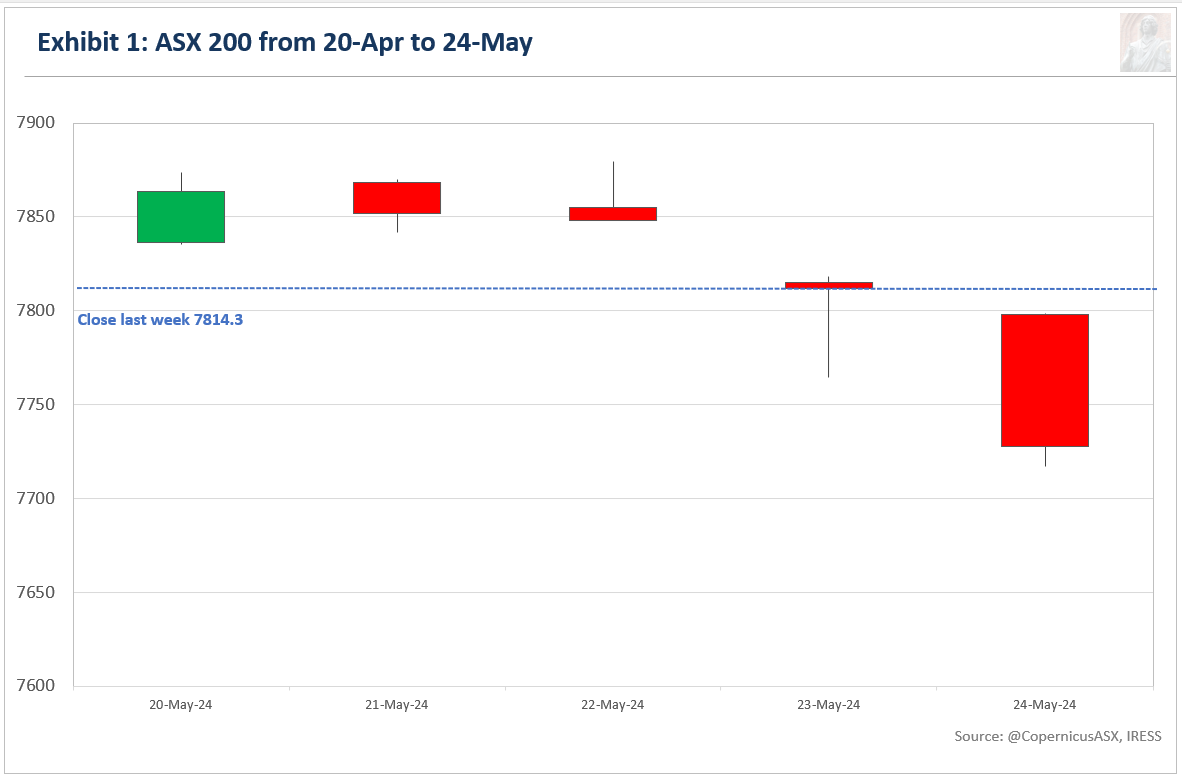
Australia's benchmark share market index, the S&P/ASX 200 (ASX 200), closed at 7727.6 points, losing 86.8 points or 1.1% for the week.
Exhibit 1 illustrates the price movement for the ASX 200 during the past week.
Last week, I wrote:
The market should move lower over the coming two weeks.
The selloff late last week reinforces the likelihood that the current price forecast for the ASX 200 is correct.
Forecast
Exhibit 2 reveals the daily high-low chart for the ASX 200 and the current interpretation of price behaviour.1
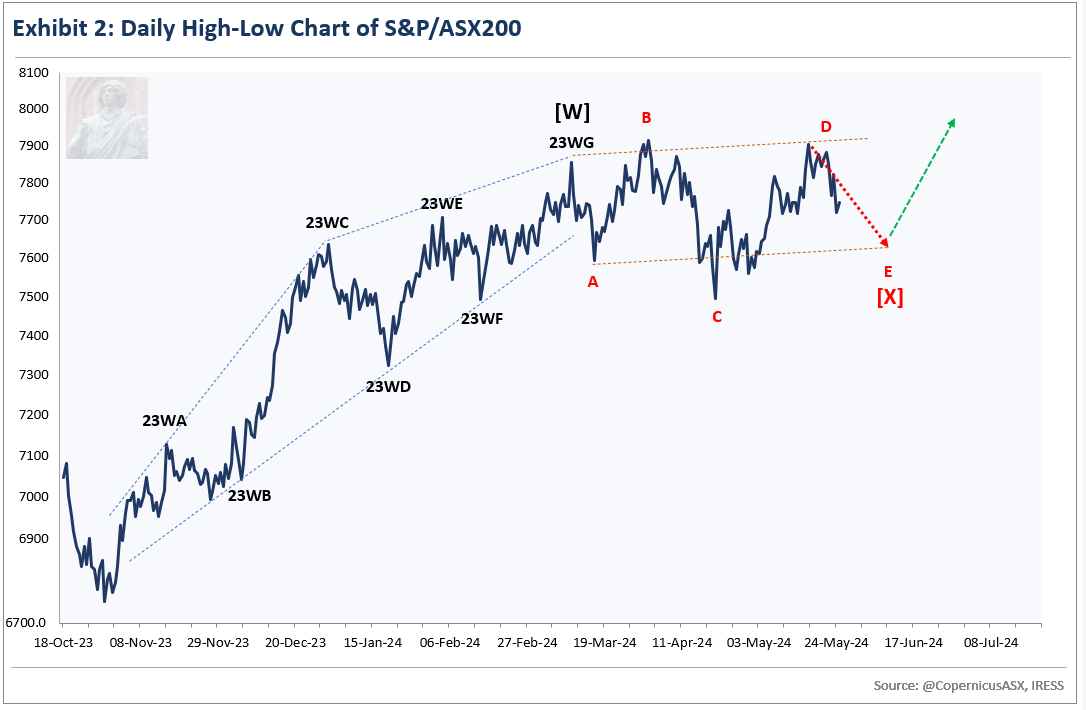
The forecast above has not been revised since last week.
Price behaviour since March 8th is consistent with the idea of a NEoWave Neutral Triangle.
A NEoWave Neutral Triangle is a price pattern that consists of five waves, which are labelled alphabetically (A-B-C-D-E). Exhibit 3 below reveals more information about this price pattern.
In a Neutral Triangle, E typically mimics A in price and/or time or is related to A by 61.8% in price and/or time. This generates approximate targets of 7617 and 7717 points.
Another consideration is that the Neutral Triangle is a Corrective Price Pattern, so it is highly likely that E will retrace at least 61.8% of the prior wave, D. This generates the likely minimum target of 7627 points.
With these considerations in mind, the likely target for E is approximately 7617 points (revised from 7636 as I have shifted the conclusion of D to the slightly lower high on Wednesday).
In terms of the duration of E, it will probably either be half the combined times of C plus D, or half the combined times of A plus C. This generates targets of 16 or 8.5 trading days.
Essentially E will likely bottom around 7617 points sometime in the next two weeks.
Upon the completion of E, the market will be at a bifurcation point, where a new regime of market behaviour could emerge. In other words, this will be the first opportunity since March 8th that a significant rally could commence. The magnitude and rate of ascent of the move after E will confirm whether this next upside advance has commenced, or whether investors require more time in which case the Neutral Triangle may morph into a NEoWave Diametric (which would postpone the next upside phase by four to six weeks) or the Neutral Triangle may just be the first pattern of an even larger sideways sequence (which would postpone the next upside phase by at least a few months).
I will be buying whatever bottom transpires in the next one to two weeks on the presumption the next upside phase is starting.
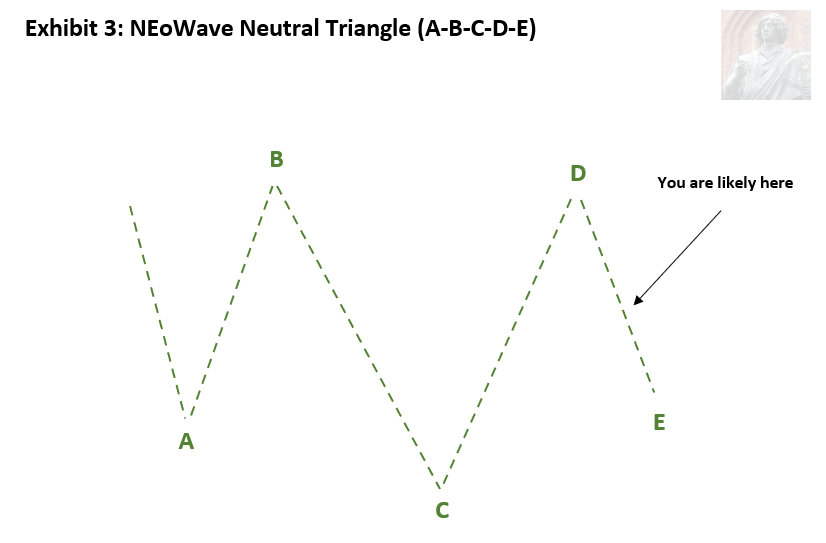
The NEoWave Neutral Triangle is a corrective price pattern consisting of five waves, labelled alphabetically (A-B-C-D-E). It includes three trending waves (A, C, & E) and two countertrend waves (B & D). Wave-C is the longest of the trending waves. Waves-A and -E tend towards equality in price and/or time or relate by 61.8% in price and/or time.
Exhibit 4 reveals the weekly high-low chart for the ASX 200.
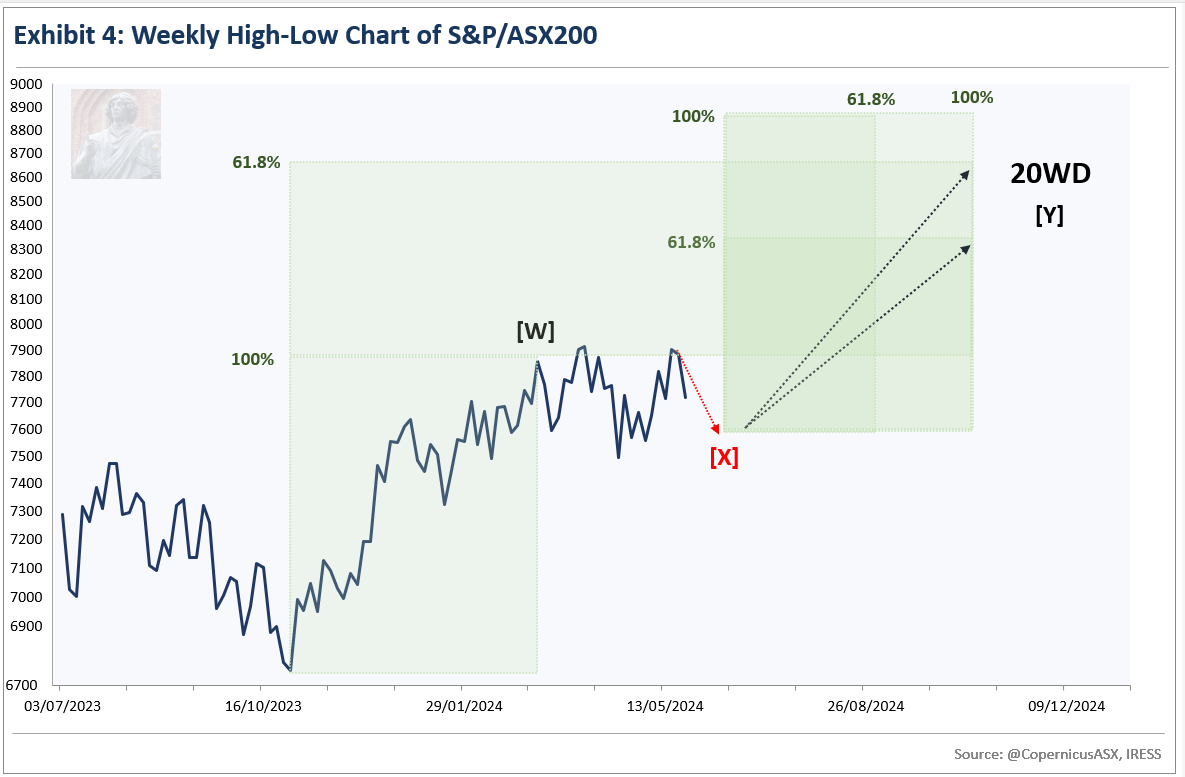
The forecast above has not been revised since last week.
[X] will be followed by a major rally, which will be labelled [Y].
[Y] will likely be related to [W] either internally or externally.
If these two major rallies relate externally, the target is 8629 points, derived by taking 61.8% of [W] and adding it to the top of [W].
Alternatively, [Y] could relate to [W] internally by 61.8% or 100%. Specific levels can only be calculated once the conclusion of [X] has been confirmed.
For the time being, I will assume [Y] will relate to [W] by 100% in time, which suggests October for its conclusion. Other possible relations are 61.8% or 161.8% of the time of [W].
Exhibit 5 reveals the six-monthly high-low chart for the ASX 200.
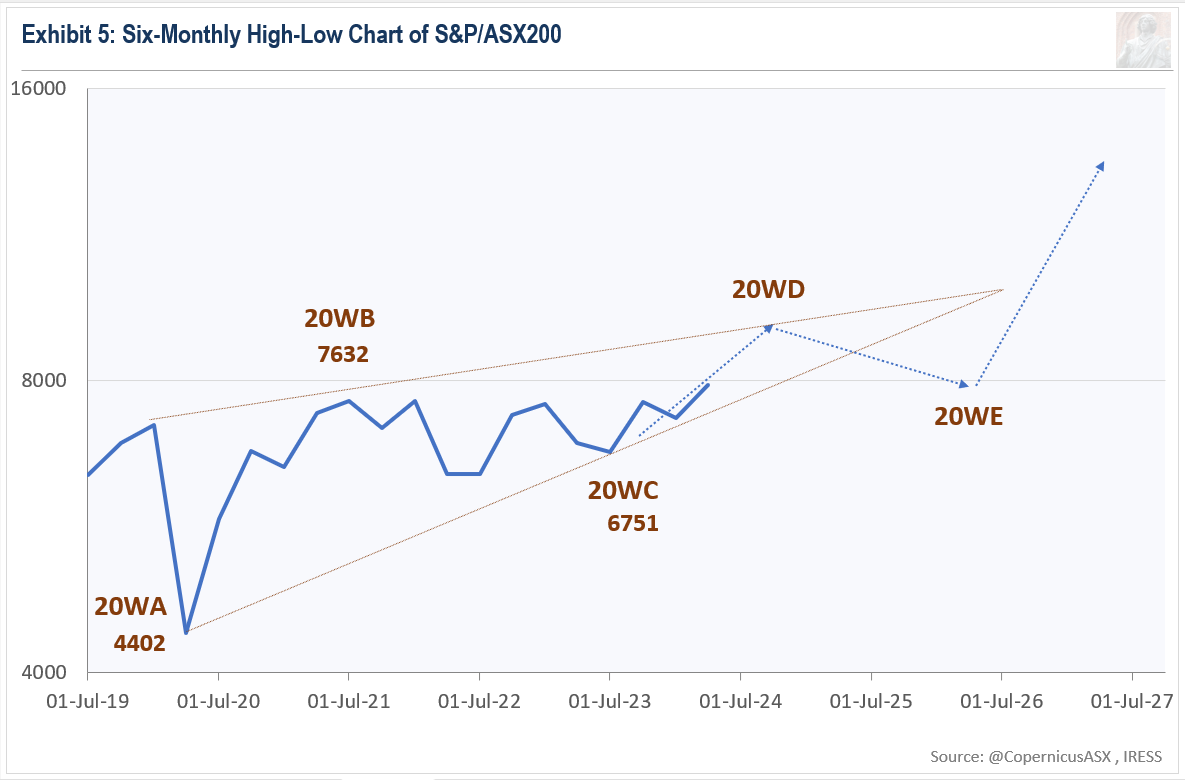
The forecast above has not been revised for many months.
Wave Structure is consistent with a NEoWave Contracting Triangle (running variation) commencing in March 2020. Exhibit 6 below reveals more information about this price pattern.
There is sufficient evidence to confirm the likelihood that 20WD, Wave-D of the Corrective Price Pattern that commenced in 2020, is currently underway.
Per the six-monthly high-low chart, the minimum measured move for 20WD is likely 8200 points. It could go as high as 8500 to 8700 points. 20WD will likely finish in the second half of this year.
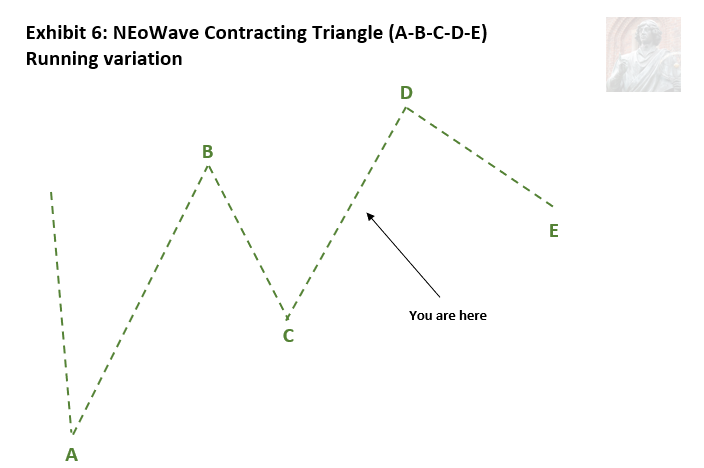
The NEoWave Contracting Triangle is a corrective price pattern that consists of five waves. It includes three trending waves (A, C, & E) and two countertrend waves (B & D). Each successive trending wave is smaller than the preceding trending wave, which is why it is called "contracting."
The “running” variation of a Contracting Triangle is rare. Both countertrend rallies are more substantial than the trending wave that they follow. Although they are larger in price, they move at a slower rate, which is why they are considered countertrend in nature. As a result, the correction happens "on the run". This pattern indicates a very strong (or weak if this price pattern occurs during a downtrend) market, and you can expect a significant move after the completion of the running Contracting Triangle.
Around the traps
Exhibit 7 compares the Banking and Materials sectors since the start of 2024.
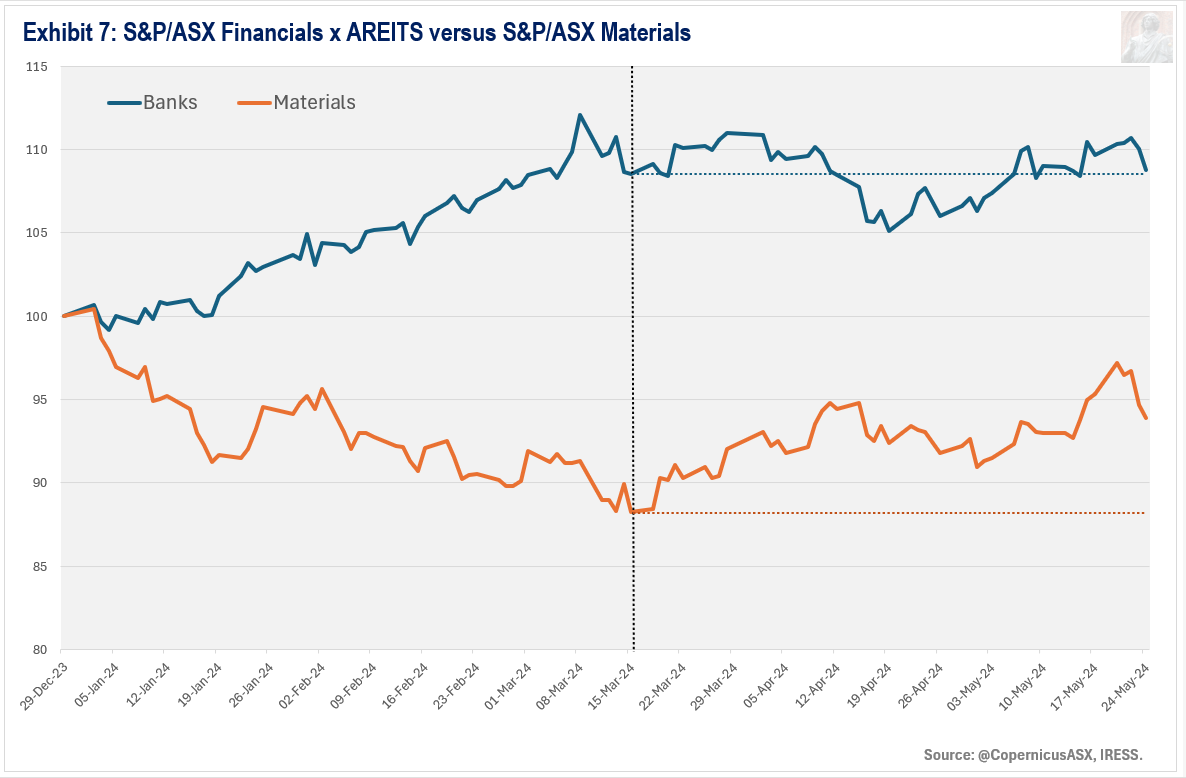
Rock > Paper.
On 15 March, I wrote that I expect:
A large rotation out of banks and into mining companies.
Mining and related companies continue to outperform the Banks. This is exactly what one should expect heading into a meaningful market top, which I have pencilled in for later this year.
While a number of different scenarios are possible, I believe the most probable scenario is that the Materials Index will be 10-30% higher over the next six months.
This rally in mining and energy companies will likely coincide with rising interest rates. A cursory glance at the chart of the Aussie 10-year bond suggests the yield could be 1-2% higher than where it currently sits in the next 6-12 months. Please note that this is not a forecast. However, from a philosophical viewpoint, it makes for an excellent catalyst to usher in a meaningful top for the ASX 200 later this year.
Rising interest rates would be a significant tailwind for the remainder of the share market. On the bright side for Bank investors is that the price action over the past few weeks has invalidated the hypothesis that a blowoff top may have occurred. For the time being, the risk-reward profile is skewed to the upside for the Banks, but it is much less attractive than what the miners and energy companies offer.
Portfolio Management
While Wave Structure points to the likelihood of much higher prices for the ASX 200 over the next 6 to 9 months, this rally will likely be concentrated in fewer and fewer stocks as it progresses. It still makes sense to remain fully invested, but only in companies performing well from a price viewpoint.

Na Golici (On Mount Golica). This mountain, famous for its daffodils, was the inspiration for the song, Na Golici - the most played instrumental of the twentieth century and, according to some sources, the second most played song of all time, after only “Yesterday” from The Beatles.
Disclaimer
This market letter was prepared by Daniel Goulding and represents the views and opinions of the author. It does not constitute investment advice. My work is didactic in nature, serving to increase readers’ awareness of an alternative philosophy of financial markets. I write generally and cannot determine whether an investment is appropriate for your particular needs, individual circumstances or risk profile. You should consult a financial adviser if you require professional assistance with your portfolio. I am not licenced or affiliated with any licensee. Therefore, I am free to speak my mind.
Lexicon
Composite Advance-Decline Line (A-D Line): the cumulative total of the number of advancing issues (stocks that closed higher) less the number of declining issues (stocks that closed lower) each day. The A-D Line is the classic measure of market breadth – a term that describes how many stocks are participating in a market trend. When the majority of stocks are moving higher, this is reflected in a rising A-D Line. A declining A-D Line, on the other hand, indicates that the majority of stocks are moving lower.
Corrective price pattern: A reaction against the prevailing trend of one larger degree. Overlapping is a common feature although it is not a strict prerequisite. Corrections are an outgrowth of indecision or ambiguity with respect to the future. They are labelled alphabetically (A-B-C etc).
Elliott Wave Principle: the idea that market behaviour is self-affine in nature due to recurrent oscillations in public opinion across different but simultaneous timeframes. It posits that price action can be defined, quantified and classified, and used to project the future evolution of price.
Impulsive price pattern: A fast-moving market. Impulse waves produce a significant change in the price level. A distinctive feature is minimal or no overlapping, depicting a strong level of conviction about the outlook. They contain five segments labelled numerically (waves 1-2-3-4-5).
Last Hour Index: the cumulative measure of the net change in a share market index during the last hour of trade. The idea behind this indicator is that large market participants are most active in the last hour of trading when liquidity is at its zenith, as well as being the final opportunity for them to open or close positions ahead of the close of trade.
NEoWave: Neely Extensions of Elliott Wave. The body of knowledge enunciated by Glenn Neely, represents a significant break or extension of the original theory postulated by Ralph Elliott.
Price behaviour: the quantitative assessment of price action. Essentially, the largest, fastest moves are always in the direction of the prevailing psychological trend.
Wave structure: the quantitative relationship between different waves of price action.
Transmission time:
Sydney: 25-May-2024 22:55
Ljubljana: 25-May-2024 14:55
London: 25-May-2024 13:55
New York: 25-May-2024 08:55
A high-low chart plots the period's highs and lows in the order in which they occur.