


ASX 200 Forecast 2024-Sep-26
Looming top in next one to two months

Summary
Next one to two months
Significant top. The ASX 200 will likely peak between 8400 to 8650 points in late October or early November.
Late 2024-2027/2028
Bear market. Following the upcoming peak, a 2–3-year bear market will unfold.
2027-2028
A new secular bull market, defined here as a significant multi-decade advance, will commence sometime in 2027 or 2028. Long-term wave structure and price behaviour suggest it will be the greatest bull market in the history of Australian equities.
Disclaimer: at end.
Disclosure: I will be closing my levered short ASX 200 position shortly.
Forecast
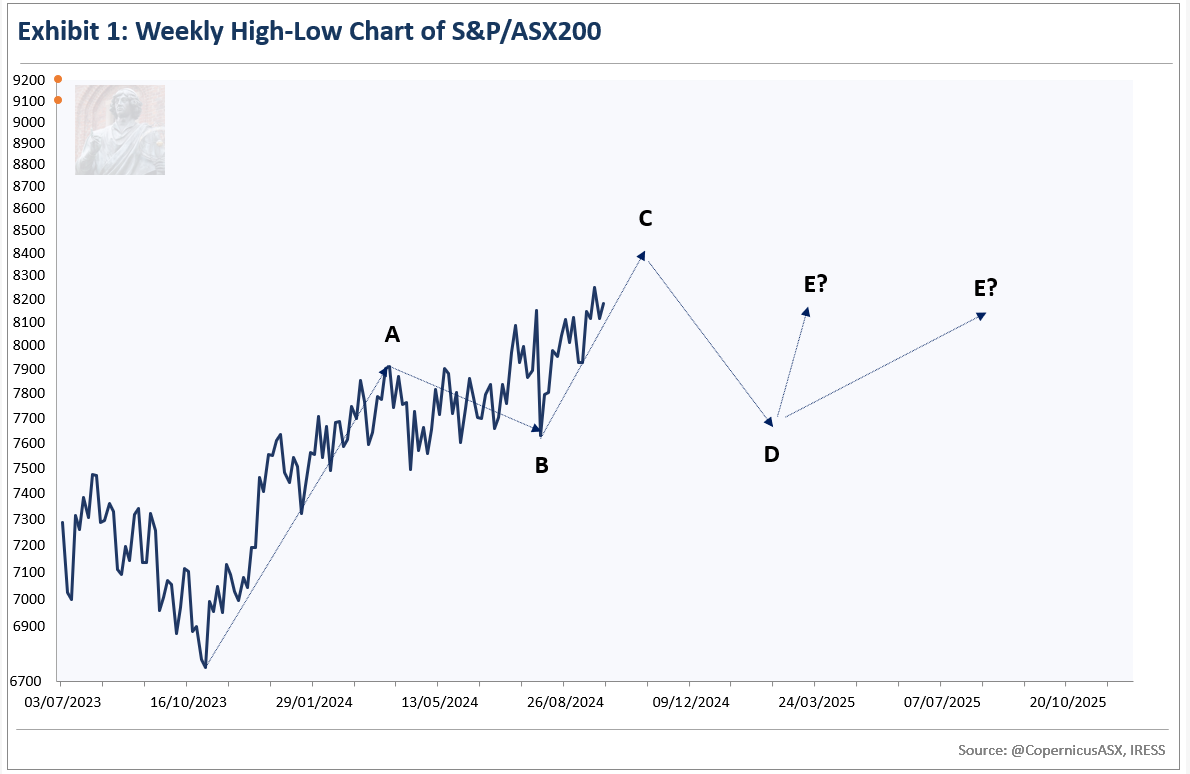
Exhibit 1 depicts a revised interpretation of price behaviour on the weekly high-low chart for the ASX 200.1
For the last week, I have been analysing the sharp decline in early August and the subsequent recovery and how they fit into the bigger picture.
The first move of a new trend should retrace the majority or entirety of the last move of the prior trend in the same amount of time or less and in a simpler manner.2
The move off the early August low is significantly more complicated and time-consuming relative to the decline before it, so it cannot be the start of a new trend from a psychological or NEoWave viewpoint.
While a NEoWave Flat remains a valid interpretation of recent price action, time is starting to become an issue for this interpretation. It no longer gels well with the idea of a market peak in October or November this year, which is the best candidate for a peak according to the long-term Wave Structure. In any case, I believe the price action in the next few weeks will decisively rule out this interpretation.
The Monthly high-low chart offers an alternative interpretation of recent price action, which is not readily visible on either the daily or weekly high-low chart. In this interpretation, the sideways correction that started earlier this year terminated at the August low. It was wave B (rather than an X-wave) of a NEoWave Contracting Triangle with the subsequent rally wave C. Appendix One provides a deep dive into this price pattern. The projected peak or completion date for Wave C using the weekly chart is late October or early November, which gels well with long-term Wave Structure.
With this in mind, I am adopting the NEoWave Contracting Triangle as the primary interpretation of price action.
The third variation of this price pattern, per Appendix One, is the one that is unfolding, which means wave C will be the peak, with wave E a lower high in the future.
Wave C is usually 61.8% of wave A. This generates a price target of 8402 points. Now, in some instances, wave C can extend past this point by a margin, with wave E finishing at the point where wave C should have ended. With this in mind, wave C will likely peak between 8400 and 8650 points.
As Wave A and B are very different in time, Wave C should be the average of these waves, suggesting late October or early November as the peak.
Wave D will likely pull back towards 7800 in 1Q2025 or 2Q2025 (first or second quarter of 2025). So, the ASX 200 may finish the year somewhere around 8200 points, which is the end-of-year target I provided at the start of this year. See here.
I am levered short the ASX 200. I will look to close this position out shortly for a loss, which will be the first loss for the year. Ideally, I will get long if the market can have a down day or two.
Smart money
Exhibit 2 compares the ASX 200 with the Last Hour Index, a gauge of what participants with deep pockets (smart money) are doing.
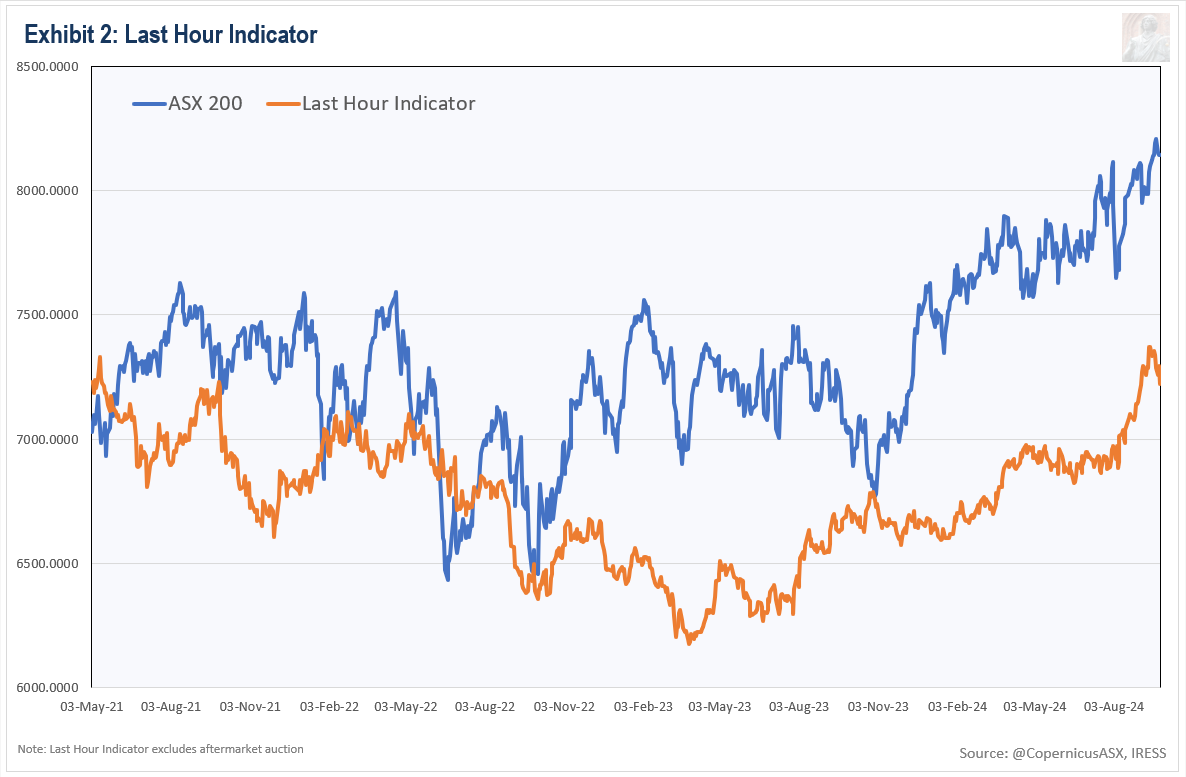
Since its September 13 peak, this indicator has moved lower. I would expect to see more of a pullback in this indicator if the market is preparing to top in the next one to two months.
Portfolio Management
Most stocks top well before the actual peak of a bull market. With a looming top, investors should be extra vigilant with their portfolios in the next one to two months.
Appendix One

The NEoWave Contracting Triangle is a corrective price pattern consisting of five waves: three trending waves labelled A, C, and E, and two countertrend waves, B and D.
Each successive trending wave is smaller than the preceding one, hence the designation "contracting".
PRICE
Wave A is a significant violent move relative to nearby price action. It is usually the longest leg of the triangle.
Wave B should retrace at least 33-38.2% of wave A at a minimum. It usually retraces 61.8% or more. In some instances, wave B can be the longest leg of the triangle.
Wave C is almost always 61.8% of wave A’s price. In some instances, it can extend further - in which case wave E will complete where wave C should have completed.
Wave D should retrace at least 33-38.2% of Wave C at a minimum. It usually retraces 61.8% or more. It should alternate with wave B in as many ways as possible. Alternation can occur via the following: price, time, retracement, complexity (essentially how many up and down moves comprise the wave) and construction (each leg of a tringle will subdivide into its own price pattern).
TIME
Although Wave B is usually longer than Wave A in duration, there are instances where it can be shorter.
When two adjacent waves of a triangle are similar in time, the next wave will likely be the sum of the combined times of the two adjacent waves. If the two adjacent waves are very different in duration, the duration of the next wave will likely be the average of the two adjacent waves.
POST PATTERN BEHAVIOUR
The thrust after a NEoWave Contracting Triangle will generally be as large as the widest leg of the Triangle. Confirmation of a new trend requires the initial rally to be larger and faster than the longest countertrend rally of the price pattern, either wave B or D.
Lexicon
Composite Advance-Decline Line (A-D Line): the cumulative total of the number of advancing issues (stocks that closed higher) less the number of declining issues (stocks that closed lower) each day. The A-D Line is the classic measure of market breadth – a term that describes how many stocks are participating in a market trend. When the majority of stocks are moving higher, this is reflected in a rising A-D Line. A declining A-D Line, on the other hand, indicates that the majority of stocks are moving lower.
Corrective price pattern: A reaction against the prevailing trend of one larger degree. Overlapping is a common feature although it is not a strict prerequisite. Corrections are an outgrowth of indecision or ambiguity with respect to the future. They are labelled alphabetically (A-B-C etc).
Elliott Wave Principle: the idea that market behaviour is self-affine in nature due to recurrent oscillations in public opinion across different but simultaneous timeframes. It posits that price action can be defined, quantified and classified, and used to project the future evolution of price.
Impulsive price pattern: A fast-moving market. Impulse waves produce a significant change in the price level. A distinctive feature is minimal or no overlapping, depicting a strong level of conviction about the outlook. They contain five segments labelled numerically (waves 1-2-3-4-5).
Last Hour Index: the cumulative measure of the net change in a share market index during the last hour of trade. The idea behind this indicator is that large market participants are most active in the last hour of trading when liquidity is at its zenith, as well as being the final opportunity for them to open or close positions ahead of the close of trade.
NEoWave: Neely Extensions of Elliott Wave. The body of knowledge enunciated by Glenn Neely, represents a significant break or extension of the original theory postulated by Ralph Elliott.
Price behaviour: the quantitative assessment of price action. Essentially, the largest, fastest moves are always in the direction of the prevailing psychological trend.
Wave structure: the quantitative relationship between different waves of price action.
Transmission time:
Sydney: 26-September-2024 13:40
Ljubljana: 26-September-2024 05:40
London: 26-September-2024 04:40
New York: 25-September-2024 23:40
Disclaimer
This market letter was prepared by Daniel Goulding and represents the views and opinions of the author. It does not constitute investment advice. My work is didactic in nature, serving to increase readers’ awareness of an alternative philosophy of financial markets. I write generally and cannot determine whether an investment is appropriate for your particular needs, individual circumstances or risk profile. You should consult a financial adviser if you require professional assistance with your portfolio.
Theses and forecasts in this content may not develop as predicted. Any or all of the content is subject to change at any time and at author’s discretion.
A high-low chart plots the period's highs and lows in the order in which they occur. I only utilise price action between 10:10 and 16:00 when the market is fully open.
The one exception to this rule is when a new trend possesses an expanding bias where the smallest move of the trend occurs first, and the largest move of the pattern occurs at the end. But with the likelihood of a significant bear market starting sometime this year or 1H2025, market momentum should be stalling, not accelerating.