


The outlook for the ASX 200 in 2025
Down.

Disclaimer: This market letter represents the views and opinions of the author. It does not constitute investment advice. It is my online journal to share knowledge of an alternative philosophy of financial markets and how I use this philosophy to trade. You should consult a financial adviser if you require professional assistance with your portfolio. I am not a financial adviser.
YEAR-END FORECAST: 7700
In the wake
Australia's benchmark share market index, the S&P/ASX 200 (ASX 200), finished calendar year 2024 at 8159.10 points, just shy of my year-end target of 8200 points.
Earlier this year, I wrote:
The minimum move for 20WD is likely 8200 points, while Price Behaviour indicates that it could go as high as 8500 to 8700 this year. 20WD is likely to finish between September and December.
After this multi-year top, the market will move sideways with a downward bias for 1-2 years, starting with a sharp 5 to 10% decline.
Unless evidence to the contrary emerges, this is the broad framework to work within. There will be moderate to significant upside for most of this year, offset by a reasonable decline towards the end of the year. Balancing all the probable scenarios from the viewpoint of Wave Structure, the year-end target is set at 8200 points.
The all-time high was 8514.5 points on December 3. From this high, there was a 5.4% decline into the December 20 low of 8051.2 points.
I made two other calls in the same outlook piece: that Large Caps would outperform Small and Micro Caps and that Quality would outperform Junk as a factor. This view was predicated on how market tops occur.
In terms of Index Leadership, it was a mixed call. Large Caps outperformed their Small Cap brethren but underperformed Micro Caps.
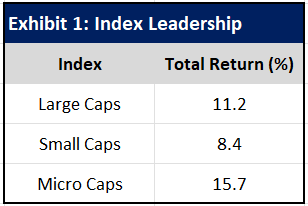
In terms of factors, Quality returned 13.26%. S&P Dow Jones Indices doesn’t calculate a Junk Index for Australia, but Quality outperformed the ASX 200, which returned 11.44%. Therefore, it is reasonable to presume that Quality probably outperformed Junk.1
Forecast
Exhibit 2 reveals the weekly high-low chart for the S&P/ASX 200, Australia’s benchmark share market index. A high-low chart plots the highs and lows of the period in the order that they occur.
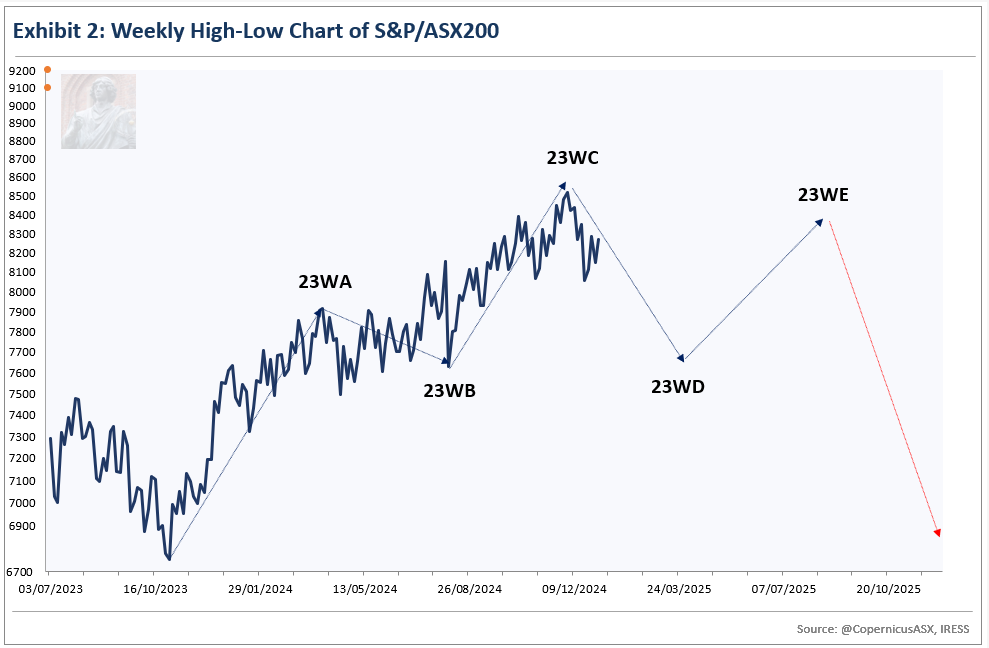
Wave Structure - how various market advances and declines relate to one another from a psychological or quantitative viewpoint - is consistent with a NEoWave Contracting Triangle commencing in late 2023.
The NEoWave Contracting Triangle is a corrective price pattern consisting of five segments or waves: three trending waves labelled A, C, and E, and two countertrend waves, B and D. Appendix One provides a deep dive into this price pattern.
It is likely that 23WD - Wave-D of the corrective price pattern that commenced in 2023 - is underway.
Given the parameters of this corrective price pattern, 23WD is likely to bottom between 7500 to 7700 points before or by late March or early April. 23WE is likely to complete around 8402 points before or by the middle of July.
23WE will not only complete a Contracting Triangle but will also likely complete a corrective price pattern on a larger time scale, which means that the direction for the ASX 200 is sideways to down for the next few years. Wave Structure suggests a decline of around 24% from peak to trough, with the low probably occurring in 2026.
Unless evidence to the contrary emerges, this is the general framework to follow for the next 12 months. Upside risk from current levels is minimal. The ASX 200 is expected to trade around 7500-7700 points in late 1Q2025 or early 2Q2025 before experiencing a recovery into the middle of the year. A more significant decline is anticipated to begin later this year. Balancing all the probable scenarios from the viewpoint of Wave Structure, the year-end target is set at 7700 points.
The forecast with specific price targets and timeframes may be incorrect in two ways.
First, the interpretation of price action as a Contracting Triangle may be valid, but the durations for 23WD and 23WE are quite different from my forecast. The timeframe for 23WD is calculated by averaging the durations of 23WB and 23WC, while the timeframe for 23WE is determined by averaging the durations of 23WA and 23WC. I am using the most likely time relationships, given price action to date, between adjoining and adjacent waves; however, other potential time relationships could be at play. Even in that scenario, the durations of waves in a Triangle generally tend to be more similar than different. Therefore, while the timeline may stretch or shrink by a modest degree, the forecasted price levels are likely to remain accurate.
Second, the interpretation of price action as a Contracting Triangle could be incorrect. In this case, understanding longer-term Wave Structure is crucial. It indicates that 2H2024 was the most likely timeframe for a peak, regardless of the corrective price pattern that is developing. Therefore, even in this situation, the expected direction for ASX 200 over the next few years is sideways to down. A decline of 24% from peak to trough is still the expectation, although it would begin at a much later date.
I am happy to field questions below in the comments section.
Disclosure
Investment accounts
On December 3, I finished the sale of all non-core holdings, retaining some quality and speculative stocks for the medium to long term.
I have yet to hedge the downside risk with respect to the remaining stocks.
Trading Accounts
I am still levered long the ASX 200. On a rally to 8390 points or thereabouts, I will take (small) profits on levered long positions and will likely pull the trigger on a new levered short position.
Appendix One

The NEoWave Contracting Triangle is a corrective price pattern consisting of five segments or waves: three trending waves labelled A, C, and E, and two countertrend waves, B and D.
Each successive trending wave is smaller than the preceding one, hence the designation "contracting".
PRICE
Wave-A is a significant violent move. It is usually the longest leg of the triangle.
Wave-B should retrace at least 33-38.2% of wave-A. It usually retraces around 80%. In some instances, wave-B can be the longest wave of the triangle.
The ideal price conclusion of wave-C is 61.8% of wave-A. In some instances, when this wave reaches the highest point of the price pattern, it will extend past the ideal price conclusion by a margin.
Wave-D should retrace at least 33-38.2% of Wave-C. It usually retraces 61.8% or more. It should alternate with wave-B in as many ways as possible. Alternation can occur via the following: price, time, the severity of retracement of the prior wave, complexity (essentially how many up and down moves comprise the wave) and construction (each leg of a triangle will subdivide into its own price pattern if the chart shows sufficient detail). Wave-D can be longer than Wave B - this is known as reverse alternation (this is not permissible in orthodox Elliott Wave).
TIME
Although Wave-B is usually longer than Wave-A in duration, there are instances where it can be shorter.
When two adjacent waves of a triangle are similar in time, the next wave will likely be the sum of the combined times of the two adjacent waves. If the two adjacent waves are very different in duration, the duration of the next wave will likely be the average of the two adjacent waves.
POST PATTERN BEHAVIOUR
The thrust after a NEoWave Contracting Triangle will generally be as large as the widest wave of the Triangle. Confirmation of a new trend requires the initial rally to be larger and faster than the longest countertrend rally of the price pattern, either wave-B or -D.
Lexicon
Composite Advance-Decline Line (A-D Line): the cumulative total of the number of advancing issues (stocks that closed higher) less the number of declining issues (stocks that closed lower) each day. The A-D Line is the classic measure of market breadth – a term that describes how many stocks are participating in a market trend. When the majority of stocks are moving higher, this is reflected in a rising A-D Line. A declining A-D Line, on the other hand, indicates that the majority of stocks are moving lower.
Corrective price pattern: A reaction against the prevailing trend of one larger degree. Overlapping is a common feature although it is not a strict prerequisite. Corrections are an outgrowth of indecision or ambiguity with respect to the future. They are labelled alphabetically (A-B-C etc).
Elliott Wave Principle: the idea that market behaviour is self-affine in nature due to recurrent oscillations in public opinion across different but simultaneous timeframes. It posits that price action can be defined, quantified and classified, and used to project the future evolution of price.
Impulsive price pattern: A fast-moving market. Impulse waves produce a significant change in the price level. A distinctive feature is minimal or no overlapping, depicting a strong level of conviction about the outlook. They contain five segments labelled numerically (waves 1-2-3-4-5).
Last Hour Index: the cumulative measure of the net change in a share market index during the last hour of trade. The idea behind this indicator is that large market participants are most active in the last hour of trading when liquidity is at its zenith, as well as being the final opportunity for them to open or close positions ahead of the close of trade.
NEoWave: Neely Extensions of Elliott Wave. The body of knowledge enunciated by Glenn Neely, represents a significant break or extension of the original theory postulated by Ralph Elliott.
Price behaviour: the quantitative assessment of price action. Essentially, the largest, fastest moves are always in the direction of the prevailing psychological trend.
Wave structure: the quantitative relationship between different waves of price action.
Transmission time:
Sydney: 05-Jan-2025 20:34
Ljubljana: 05-Jan-2025 10:34
London: 05-Jan-2025 09:34
New York: 05-Jan-2025 04:34
These figures are taken from S&P Dow Jones Indices Australia and New Zealand Dashboard, 31 December 2024.